Working with Local ApplicationsWhen you start Java VisualVM, a node for each local Java application is displayed under the Local node in the Applications window.
You can expand an application node to see the profiler snapshots, thread dumps and heap dumps of the application.
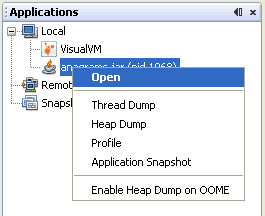
Right-clicking an application node or sub-node invokes a popup menu enabling you to choose various actions. 
A local application node generally has the following items available in the popup menu.
You can perform the following tasks directly from the popup menu. View Application DataJava VisualVM displays data about each running local application in a dedicated tab in the main window. Each application tab has sub-tabs where information about that application is displayed. To open the application tab, right-click the application node in the Applications window and choose Open. (Alternatively, double-click the application node.) When you click Open, the Overview tab of the application tab opens in the main window. The application tab for a local application has the following sub-tabs:
Additional tabs and sub-tabs may be visible depending on the installed plugins. Take a Thread DumpYou can use Java VisualVM to take a thread dump to capture information about the active application threads at the time you take the thread dump. When you take a thread dump, the thread dump opens in a sub-tab of the application in the main window. A node for the thread dump appears under the application node in the Applications window. You can take a thread dump in the following ways:
When you take a thread dump, the thread dump opens in a sub-tab of the application in the main window. A node for the thread dump appears under the application node. For more about working with application threads, see the following document: Take a Heap DumpYou can take a heap dump of a local application to capture a snapshot of the objects on the heap. You can take a heap dump in the following ways:
When you take a heap dump, the heap dump opens in a sub-tab of the application in the main window. A node for the heap dump appears under the application node. For more about working with the heap, see the following document: Profile an ApplicationJava VisualVM includes a profiler that enables you to analyze the performance and memory usage of a local application.
You can profile an application without restarting it. To start a profiling session,
right-click the application node and choosing Profile from the popup menu to open the profiling tab. For more see the following document: Take SnapshotsJava VisualVM enables you to take snapshots that capture application data at the time the snapshot is taken. You can save snapshots to your local system and then examine them later or send them to others. Java VisualVM enables you to take the following types of snapshots:
For more see the following document: | ||||||||||||
|
| ||||||||||||