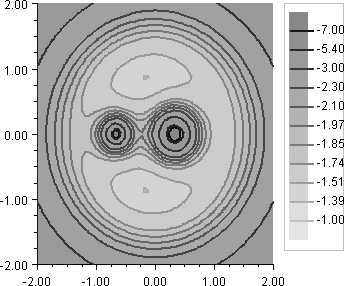
In the center-of-mass coordinate system, the effective potential energy of the system is given by
import com.imsl.chart.*;

public class ContourEx1 extends javax.swing.JApplet {
    private JPanelChart panel;

    public void init() {
        Chart chart = new Chart(this);
        panel = new JPanelChart(chart);
        getContentPane().add(panel, java.awt.BorderLayout.CENTER);
        setup(chart);
    }

    static private void setup(Chart chart) {
        int nx = 80;
        int ny = 80;

        // Allocate space
        double xGrid[] = new double[nx];
        double yGrid[] = new double[ny];
        double zData[][] = new double[nx][ny];

        // Setup the grids points
        for (int i = 0;  i < nx;  i++) {
            xGrid[i] = -2 + 4.0*i/(double)(nx-1);
        }
        for (int j = 0;  j < ny;  j++) {
            yGrid[j] = -2 + 4.0*j/(double)(ny-1);
        }

        // Evaluate the function at the grid points
        for (int i = 0;  i < nx;  i++) {
            for (int j = 0;  j < ny;  j++) {
                double x = xGrid[i];
                double y = yGrid[j];
                double rm = 0.5;
                double x1 = rm / (1.0+rm);
                double x2 = x1 - 1.0;
                double d1 = Math.sqrt((x-x1)*(x-x1)+y*y);
                double d2 = Math.sqrt((x-x2)*(x-x2)+y*y);
                zData[i][j] = x2/d1 - x1/d2 - 0.5*(x*x+y*y);
            }
        }

        // Create the contour chart, with user-specified levels and a legend
        AxisXY axis = new AxisXY(chart);
        double cLevel[] = {-7, -5.4, -3, -2.3, -2.1, -1.97, -1.85, -1.74, -1.51, -1.39, -1};
        Contour c = new Contour(axis, xGrid, yGrid, zData, cLevel);
        c.getContourLegend().setPaint(true);
    }


    public static void main(String argv[]) {
        JFrameChart frame = new JFrameChart();
        ContourEx1.setup(frame.getChart());
        frame.show();
    }
}