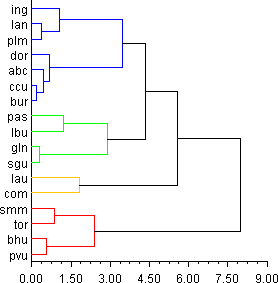
Example: Dendrogram
A Dendrogram.
import com.imsl.stat.*;
import com.imsl.chart.*;

public class DendrogramEx1 extends javax.swing.JApplet {
    private JPanelChart panel;

    public void init() {
        Chart chart = new Chart(this);
        panel = new JPanelChart(chart);
        getContentPane().add(panel, java.awt.BorderLayout.CENTER);
        setup(chart);
    }

    static private void setup(Chart chart) {

        /*
        1998 test data from 17 school districts in Los Angeles County.

        The variables were:
        lep - Proportion of LEP students to total tested
        read - The Reading Scaled Score for 5th Grade
        math - The Math Scaled Score for 5th Grade
        lang - The Language Scaled Score for 5th Grade

        The districts were:
        lau - Los Angeles
        ccu - Culver City
        bhu - Beverly Hills
        ing - Inglewood
        com - Compton
        smm - Santa Monica Malibu
        bur - Burbank
        gln - Glendale
        pvu - Palos Verdes
        sgu - San Gabriel
        abc - Artesia, Bloomfield, and Carmenita
        pas - Pasadena
        lan - Lancaster
        plm - Palmdale
        tor - Torrance
        dow - Downey
        lbu - Long Beach

        input lep read math lang str3 district
        .38 626.5 601.3 605.3 lau
        .18 654.0 647.1 641.8 ccu
        .07 677.2 676.5 670.5 bhu
        .09 639.9 640.3 636.0 ing
        .19 614.7 617.3 606.2 com
        .12 670.2 666.0 659.3 smm
        .20 651.1 645.2 643.4 bur
        .41 645.4 645.8 644.8 gln
        .07 683.5 682.9 674.3 pvu
        .39 648.6 647.8 643.1 sgu
        .21 650.4 650.8 643.9 abc
        .24 637.0 636.9 626.5 pas
        .09 641.1 628.8 629.4 lan
        .12 638.0 627.7 628.6 plm
        .11 661.4 659.0 651.8 tor
        .22 646.4 646.2 647.0 dow
        .33 634.1 632.0 627.8 lbu
        */

        double[][] data = {
            {.38, 626.5, 601.3, 605.3},
            {.18, 654.0, 647.1, 641.8},
            {.07, 677.2, 676.5, 670.5},
            {.09, 639.9, 640.3, 636.0},
            {.19, 614.7, 617.3, 606.2},
            {.12, 670.2, 666.0, 659.3},
            {.20, 651.1, 645.2, 643.4},
            {.41, 645.4, 645.8, 644.8},
            {.07, 683.5, 682.9, 674.3},
            {.39, 648.6, 647.8, 643.1},
            {.21, 650.4, 650.8, 643.9},
            {.24, 637.0, 636.9, 626.5},
            {.09, 641.1, 628.8, 629.4},
            {.12, 638.0, 627.7, 628.6},
            {.11, 661.4, 659.0, 651.8},
            {.22, 646.4, 646.2, 647.0},
            {.33, 634.1, 632.0, 627.8}};

        String[] lab = {"lau", "ccu", "bhu", "ing", "com", "smm",
                        "bur", "gln", "pvu", "sgu", "abc", "pas",
                        "lan", "plm", "tor", "dor", "lbu"};


        // 3rd arg in Dissimilarities gives different results for 0,1,2
        try {
            Dissimilarities dist = new Dissimilarities(data, 0, 1, 1);
            double[][] distanceMatrix = dist.getDistanceMatrix();
            ClusterHierarchical clink = new ClusterHierarchical(
                dist.getDistanceMatrix(),4,0);

            int nClusters = 4;
            int[] iclus = clink.getClusterMembership(nClusters);
            int[] nclus = clink.getObsPerCluster(nClusters);

            AxisXY axis = new AxisXY(chart);

            // use either method below to create the chart
            Dendrogram dc = new Dendrogram(axis, clink, Data.DENDROGRAM_TYPE_HORIZONTAL);

            dc.setLabels(lab);
            dc.setLineColor(new String[] {"Blue","Green", "Red", "Orange"});
        } catch (com.imsl.IMSLException e) {
            System.out.println(e.getStackTrace());
        }
    }

    public static void main(String argv[]) {
        JFrameChart frame = new JFrameChart();
        DendrogramEx1.setup(frame.getChart());
        frame.setVisible(true);
    }
}
Output
Link to Java source.