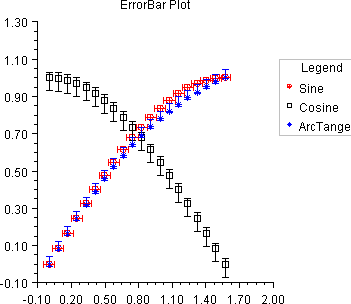
Example: ErrorBar Chart
An ErrorBar chart is constructed in this example. Three data sets are used and a legend is added to the chart. This class can be used either as an applet or as an application.
import com.imsl.chart.*;
import java.awt.Color;

public class ErrorBarEx1 extends javax.swing.JApplet {
    private JPanelChart panel;

    public void init() {
        Chart chart = new Chart(this);
        panel = new JPanelChart(chart);
        getContentPane().add(panel, java.awt.BorderLayout.CENTER);
        setup(chart);
    }

    static private void setup(Chart chart) {
        AxisXY axis = new AxisXY(chart);

        int	npoints = 20;
        double dx = .5 * Math.PI/(npoints - 1);
        double x[] = new double[npoints];
        double y1[] = new double[npoints];
        double y2[] = new double[npoints];
        double y3[] = new double[npoints];
        double low1[] = new double[npoints];
        double low2[] = new double[npoints];
        double low3[] = new double[npoints];
        double hi1[] = new double[npoints];
        double hi2[] = new double[npoints];
        double hi3[] = new double[npoints];

        //	Generate some data
        for (int i = 0; i < npoints; i++){
            x[i] = i * dx;
            y1[i] = Math.sin(x[i]);
            low1[i] = x[i] - .05;
            hi1[i] = x[i] + .05;
            y2[i] = Math.cos(x[i]);
            low2[i] = y2[i] - .07;
            hi2[i] = y2[i] + .03;
            y3[i] = Math.atan(x[i]);
            low3[i] = y3[i] - .01;
            hi3[i] = y3[i] + .04;
        }

        Data d1 = new Data(axis, x, y1);
        Data d2 = new Data(axis, x, y2);
        Data d3 = new Data(axis, x, y3);

        //	Set Data Type to Marker
        d1.setDataType(d1.DATA_TYPE_MARKER);
        d2.setDataType(d2.DATA_TYPE_MARKER);
        d3.setDataType(d3.DATA_TYPE_MARKER);

        //	Set Marker Types
        d1.setMarkerType(Data.MARKER_TYPE_CIRCLE_PLUS);
        d2.setMarkerType(Data.MARKER_TYPE_HOLLOW_SQUARE);
        d3.setMarkerType(Data.MARKER_TYPE_ASTERISK);

        //	Set Marker Colors
        d1.setMarkerColor(Color.red);
        d2.setMarkerColor(Color.black);
        d3.setMarkerColor(Color.blue);

        //	Create an instances of ErrorBars
        ErrorBar ebar1 = new ErrorBar(axis, x, y1, low1, hi1);
        ErrorBar ebar2 = new ErrorBar(axis, x, y2, low2, hi2);
        ErrorBar ebar3 = new ErrorBar(axis, x, y3, low3, hi3);

        //	Set Data Type to Error_X
        ebar1.setDataType(ebar1.DATA_TYPE_ERROR_X);
        //	Set Data Type to Error_Y
        ebar2.setDataType(ebar2.DATA_TYPE_ERROR_Y);
        ebar3.setDataType(ebar3.DATA_TYPE_ERROR_Y);

        //	Set Marker Colors
        ebar1.setMarkerColor(Color.red);
        ebar2.setMarkerColor(Color.black);
        ebar3.setMarkerColor(Color.blue);

        //	Set Data Labels
        d1.setTitle("Sine");
        d2.setTitle("Cosine");
        d3.setTitle("ArcTangent");

        //	Add a Legend
        Legend legend = chart.getLegend();
        legend.setTitle(new Text("Legend"));
        chart.addLegendItem(0, chart);
        legend.setPaint(true);

        //	Set the Chart Title
        chart.getChartTitle().setTitle("ErrorBar Plot");
    }


    public static void main(String argv[]) {
        JFrameChart frame = new JFrameChart();
        ErrorBarEx1.setup(frame.getChart());
        frame.show();
    }
}
Output
Link to Java source.