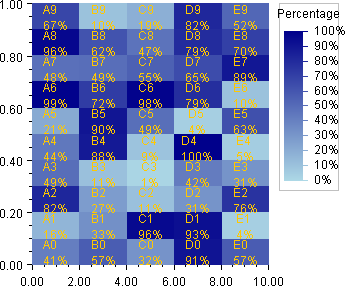
The legend is enabled by setting its paint attribute to true. The tick marks in the legend are formatted using the percentage NumberFormat
object. A title is also set in the legend.
import com.imsl.chart.*;
import java.awt.Color;
import java.text.NumberFormat;
import java.util.Random;

public class HeatmapEx3 extends javax.swing.JApplet  {

    public void init() {
        Chart chart = new Chart(this);
        JPanelChart panel = new JPanelChart(chart);
        getContentPane().add(panel, java.awt.BorderLayout.CENTER);
        setup(chart);
    }

    static private void setup(Chart chart) {
        JFrameChart jfc = new JFrameChart();
        AxisXY axis = new AxisXY(chart);

        double xmin = 0.0;
        double xmax = 10.0;
        double ymin = 0.0;
        double ymax = 1.0;

        NumberFormat format = NumberFormat.getPercentInstance();

        int nx = 5;
        int ny = 10;
        double data[][] = new double[nx][ny];
        String labels[][] = new String[nx][ny];
        Random random = new Random(123457L);
        for (int i = 0;  i < nx;  i++) {
            for (int j = 0;  j < ny;  j++) {
                data[i][j] = random.nextDouble();
                labels[i][j] = "ABCDE".charAt(i) + Integer.toString(j) + "\n"
                    + format.format(data[i][j]);
            }
        }
        Heatmap heatmap = new Heatmap(axis, xmin, xmax, ymin, ymax, 0.0, 1.0,
            data, Colormap.BLUE);
        heatmap.setHeatmapLabels(labels);
        heatmap.setTextColor("orange");
        heatmap.getHeatmapLegend().setPaint(true);
        heatmap.getHeatmapLegend().setTextFormat(format);
        heatmap.getHeatmapLegend().setTitle("Percentage");
    }

    public static void main(String argv[]) throws Exception {
        JFrameChart frame = new JFrameChart();
        HeatmapEx3.setup(frame.getChart());
        frame.show();
    }
}