Autoscaling does not properly handle time data, so autoscaling is turned off for the x (time) axis and the axis limits are set explicitly.
import com.imsl.chart.*;
import java.awt.Color;
import java.text.DateFormat;
import java.util.Date;
import java.util.GregorianCalendar;
public class HiLoEx1 extends javax.swing.JApplet {
private JPanelChart panel;
public void init() {
Chart chart = new Chart(this);
panel = new JPanelChart(chart);
getContentPane().add(panel, java.awt.BorderLayout.CENTER);
setup(chart);
}
static private void setup(Chart chart) {
AxisXY axis = new AxisXY(chart);
// Date is June 27, 1999
Date date =
new GregorianCalendar(1999, GregorianCalendar.JUNE, 27).getTime();
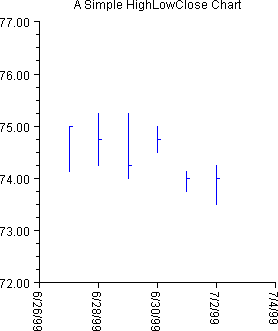
double high[] = {75., 75.25, 75.25, 75., 74.125, 74.25};
double low[] = {74.125, 74.25, 74., 74.5, 73.75, 73.50};
double close[] = {75., 74.75, 74.25, 74.75, 74., 74.0};
// Create an instance of a HighLowClose Chart
HighLowClose hilo = new HighLowClose(axis, date, high, low, close);
hilo.setMarkerColor("blue");
// Set the HighLowClose Chart Title
chart.getChartTitle().setTitle("A Simple HighLowClose Chart");
// Configure the x-axis
hilo.setDateAxis("Date(SHORT)");
}
public static void main(String argv[]) {
JFrameChart frame = new JFrameChart();
HiLoEx1.setup(frame.getChart());
frame.show();
}
}