JMSL Chart Programmer's Guide


JMSL Chart Programmer's Guide
|
Charting 2D Types >> Area Plot |
|
Area Plot
Area plots are similar to line plots, but with the area between the line and a reference
line filled in. An area plot is created if the DATA_TYPE_FILL bit is on in the
value of the DataType attribute. The default reference line is y=0. The location of
the reference line can be changed from 0 by using setReference(double). The
Fill Area Attributes determine how the area is filled.
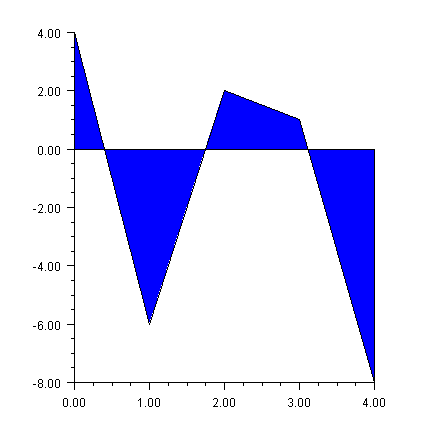
Simple Area Plot
This example draws a simple area plot. The default value of the FillType attribute is FILL_TYPE_SOLID. The example sets the FillColor attribute to blue. So the area between the line and y=0 is solid blue.
(Download Code)
import com.imsl.chart.*;
import java.awt.Color;

public class SampleArea extends JFrameChart {

    public SampleArea() {
        Chart chart = getChart();
        AxisXY axis = new AxisXY(chart);

        double y[] = {4, -6, 2, 1, -8};
        Data data = new Data(axis, y);
        data.setDataType(Data.DATA_TYPE_FILL);
        data.setFillColor(Color.blue);
    }

    public static void main(String argv[]) {
        new SampleArea().setVisible(true);
    }
}
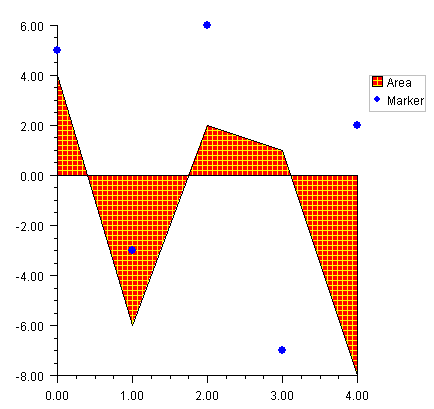
Painted Area Example
This example shows an area chart filled in with a painted texture. The texture is created
by a static method FillPaint.crosshatch.
A second data set is plotted as a set of markers.
The Legend node is painted in this example and has entries for both the filled area data set and the marker data set.
(Download Code)
import com.imsl.chart.*;
import java.awt.Color;

public class SampleAreaPaint extends JFrameChart {

    public SampleAreaPaint() {
        Chart chart = getChart();
        AxisXY axis = new AxisXY(chart);
        chart.getLegend().setPaint(true);

        double y1[] = {4, -6, 2, 1, -8};
        Data data1 = new Data(axis, y1);
        data1.setTitle("Area");
        data1.setDataType(Data.DATA_TYPE_FILL);
        data1.setFillType(Data.FILL_TYPE_PAINT);
        data1.setFillPaint(FillPaint.crosshatch
        (10,5,Color.red,Color.yellow));

        double y2[] = {5, -3, 6, -7, 2};
        Data data2 = new Data(axis, y2);
        data2.setTitle("Marker");
        data2.setDataType(Data.DATA_TYPE_MARKER);
        data2.setMarkerColor(Color.blue);
        data2.setMarkerType(Data.MARKER_TYPE_FILLED_CIRCLE);
    }

    public static void main(String argv[]) {
        new SampleAreaPaint().setVisible(true);
    }
}
Attribute Reference
The attribute Reference defines the reference line. If its value is a, then the reference line is y = a. Its default value is 0.
| © Visual Numerics, Inc. All rights reserved. |
|