JMSL Chart Programmer's Guide


JMSL Chart Programmer's Guide
|
2D Drawing Elements >> AxisXY >> Axis Title |
|
Axis Title
The AxisTitle node controls the titling of an axis. The drawing of this node is controlled by the Text Attributes (see ).
Axes are titled with the value of the Title attribute in the AxisTitle node. By default, the title is empty.
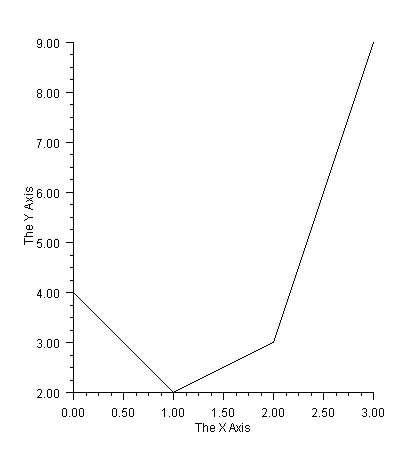
Setting the Title
To set an axis title, set the Title attribute in the AxisTitle node. In this example both the x-axis and y-axis titles are set.
import com.imsl.chart.*;

public class SampleAxisTitle extends JFrameChart {

    public SampleAxisTitle() {
        Chart chart = getChart();
        AxisXY axis = new AxisXY(chart);
        double y[] = {4, 2, 3, 9};
        new Data(axis, y);

        axis.getAxisX().getAxisTitle().setTitle("The X Axis");
        axis.getAxisY().getAxisTitle().setTitle("The Y Axis");
    }

    public static void main(String argv[]) {
        new SampleAxisTitle().setVisible(true);
    }
}
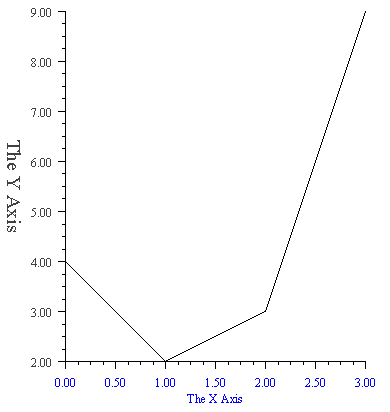
More Formatting
An axis title, like any other text string, can have further formatting applied.
The FontName attribute is set to "Serif" in the axis node. This value is then inherited
by all of it ancestor nodes.
The TextColor attribute is set differently in the x-axis and y-axis nodes. Note that this setting is inherited by both the AxisTitle and nodes within the same axis.
The y-axis title node has its FontSize attribute set to 20, so it is larger. Also, its TextAngle attribute is set to -90. By default, the y-axis title is drawn at a 90 degree angle, so the -90 degree setting flips the title from its usual position.
import com.imsl.chart.*;
import java.awt.Color;

public class SampleAxisTitleFormatted extends JFrameChart {

    public SampleAxisTitleFormatted() {
        Chart chart = getChart();
        AxisXY axis = new AxisXY(chart);
        double y[] = {4, 2, 3, 9};
        new Data(axis, y);

        axis.setFontName("Serif");

        axis.getAxisX().setTextColor(Color.blue);
        axis.getAxisX().getAxisTitle().setTitle("The X Axis");

        axis.getAxisY().setTextColor(Color.darkGray);
        axis.getAxisY().getAxisTitle().setTitle("The Y Axis");
        axis.getAxisY().getAxisTitle().setTextAngle(-90);
        axis.getAxisY().getAxisTitle().setFontSize(20);
    }

    public static void main(String argv[]) {
        new SampleAxisTitleFormatted().setVisible(true);
    }
}
| © Visual Numerics, Inc. All rights reserved. |
|