Programmer's Guide


| JMSL Chart Programmer's Guide | Introduction - Chart 2D |
|
Introduction - Chart 2D
The JMSL Numerical Library Chart Programmer's Guide is an overview and discussion of the JMSL charting package. It is intended to be used in conjunction with the online Javadoc-generated Reference Manual. This guide contains links into the Reference Manual, as appropriate. References to standard Java classes link to the "Java 2 Platform API Specification" reference manual on Sun's Web site.
This guide is both an introductory tutorial on the charting package and a "cookbook" for creating common chart types. The Reference Manual contains the complete details of the classes.
Overview
The JMSL chart package is designed to allow the creation of highly customizable charts using Java. A JMSL chart is created by assembling ChartNodes into a tree. This chart tree is then rendered to the screen or printer.
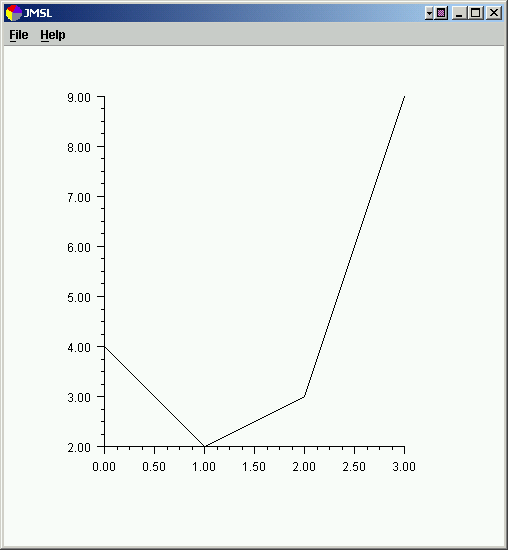
The following class is a simple example of the use of the JMSL chart package. The chart is displayed in a Swing frame. The code to create the chart is all in the constructor. The JMSL class JFrameChart extends the Swing class JFrame and creates a Chart object.
import com.imsl.chart.*;

public class Intro1 extends JFrameChart {

    public Intro1() {
        Chart chart = getChart();
        AxisXY axis = new AxisXY(chart);
        double y[] = {4, 2, 3, 9};
        new Data(axis, y);
    }

    public static void main(String argv[]) {
        new Intro1().setVisible(true);
    }
}
The above example created and assembled three nodes into the following tree. The root Chart node is created by the JFrameChart class.
The general pattern of the ChartNode class, and classes derived from it, is to have constructors whose first argument is the parent ChartNode of the ChartNode being created.
The root node of the tree is always a Chart object. It is usually constructed within
JFrameChart or JPanelChart, which handle the repainting of the chart within
Swing. If a Chart object is explicitly created, and used within a Swing GUI, then
its paint(Graphics) method must be called from the container's
paint(Graphics) or paintComponent(Graphics) methods.
Chart nodes can contain attributes, such as FillColor and LineWidth. Attributes are inherited via the chart tree. For example, when a Data node is being painted, its LineWidth attribute determines the thickness of the line. If this attribute is set in the data node being drawn, that is the value used. If it is not set, then its parent node (an AxisXY node in the above example) is queried. If it is not set there, then its parent is queried. This continues until the root node is reached after which a default value is used. Note that this inheritance is not the same as Java class inheritance.
Attributes are set using setter methods, such as setLineWidth(double) and
retrieved using getter methods, such as getLineWidth(double).
Implicitly Created Nodes
Some chart nodes automatically create additional nodes, as their children, when
they are created. These nodes can be accessed via get methods. For example, the
code
chart.getBackground().setFillColor(java.awt.Color.green);
changes the background color. The method getBackground retrieves the Background
node from the chart object and the method setFillColor sets the
Background object's FillColor attribute to Color.green.
In the following diagram, the nodes automatically created are shown in light green.
Method calls can be chained together. For example, the following sets the thickness of the major tick marks on the y-axis.
axis.getAxisX().getMajorTick().setLineWidth(2.0);
where axis is an AxisXY object.
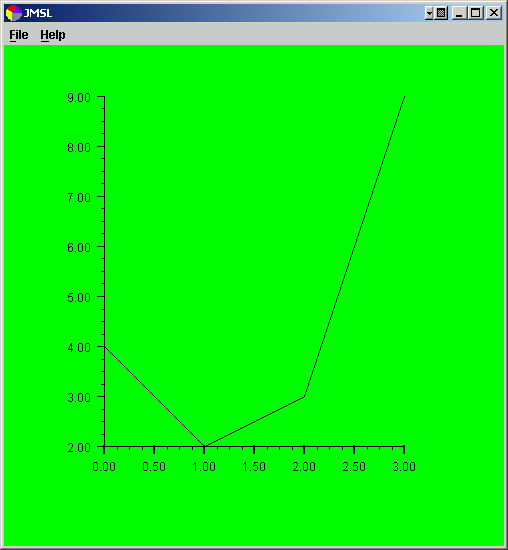
A customized version of the above chart can be obtained by changing its constructor as in the following.
(Download Code)
import com.imsl.chart.*;

public class Intro2 extends JFrameChart {

    public Intro2() {
        Chart chart = getChart();
        AxisXY axis = new AxisXY(chart);
        double y[] = {4, 2, 3, 9};
        new Data(axis, y);
        chart.getBackground().setFillColor(java.awt.Color.green);
        axis.getAxisX().getMajorTick().setLineWidth(2.0);
    }

    public static void main(String argv[]) {
        new Intro2().setVisible(true);
    }
}
Adding a Chart to an Application
For simplicity, most of the examples in this manual use the JFrameChart class.
JFrameChart is useful for quickly building an application that is a chart. The
class JPanelChart is used to build a chart into a larger application. It extends
Swing's JPanel class and can be used wherever a JPanel can be used. The following
code shows a JPanelChart being created, added to a JFrame, and
having a chart tree added to the JPanelChart. The generated chart is the same as
the first one on this page and so is not shown here.
(Download Code)
import com.imsl.chart.*;

public class SampleJPanel extends javax.swing.JFrame {
    private JPanelChart jPanelChart;

    public SampleJPanel() {
        this.setSize(500, 500);
        jPanelChart = new JPanelChart();
        getContentPane().add(jPanelChart);

        Chart chart = jPanelChart.getChart();
        AxisXY axis = new AxisXY(chart);
        double y[] = {4, 2, 3, 9};
        new Data(axis, y);
    }

    public static void main(String argv[]) {
        new SampleJPanel().setVisible(true);
    }
}
| © Visual Numerics, Inc. All rights reserved. |
|