JMSL Chart Programmer's Guide


JMSL Chart Programmer's Guide
|
Charting 2D Types >> Log and SemiLog Plot |
|
Log and SemiLog Plot
In a semilog plot the y-axis is logarithmically scaled, while the x-axis is linearly scaled. In a log-log plot both axes are logarithmically scaled.
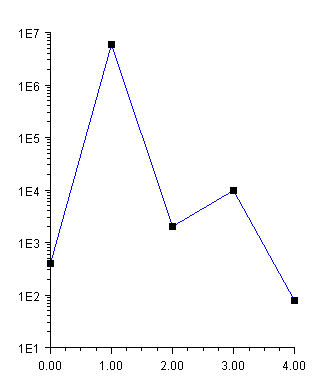
SemiLog Plot
In this example data is plotted as lines and markers on a semilog axis.
To set up the y-axis as a logarithmic axis,
The TextFormat, used by AxisLabel, is changed to use scientific notation (see Text Attributes). The default decimal format would result in large numbers written with many zeros.
(Download Code)
import com.imsl.chart.*;
import java.awt.Color;

public class SampleSemiLog extends JFrameChart {

    public SampleSemiLog() {
        Chart chart = getChart();
        AxisXY axis = new AxisXY(chart);
        axis.getAxisY().setTransform(axis.TRANSFORM_LOG);
        axis.getAxisY().setDensity(9);
        axis.getAxisY().setTextFormat(new java.text.DecimalFormat("0.E0"));

        double y[] = {4e2, 6e6, 2e3, 1e4, 8e1};
        Data data = new Data(axis, y);
        data.setDataType(Data.DATA_TYPE_LINE | Data.DATA_TYPE_MARKER);
        data.setLineColor(Color.blue);
        data.setMarkerType(Data.MARKER_TYPE_FILLED_SQUARE);
    }

    public static void main(String argv[]) {
        new SampleSemiLog().setVisible(true);
    }
}
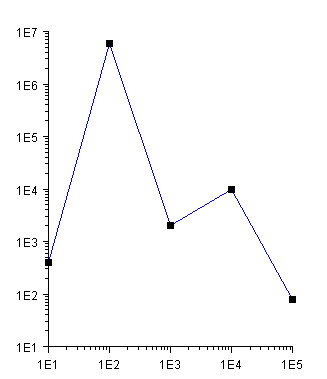
Log-Log Plot
A log-log plot is set up in much the same way as a semilog plot, except that the changes must be made to both the x-axis and the y-axis. In this example, the changes are made to the axis node and inherited by both the x and y-axis nodes.
(Download Code)
import com.imsl.chart.*;
import java.awt.Color;

public class SampleLogLog extends JFrameChart {

    public SampleLogLog() {
        Chart chart = getChart();
        AxisXY axis = new AxisXY(chart);
        axis.setTransform(axis.TRANSFORM_LOG);
        axis.setDensity(9);
        axis.setTextFormat(new java.text.DecimalFormat("0.E0"));

        double x[] = {1e1, 1e2, 1e3, 1e4, 1e5};
        double y[] = {4e2, 6e6, 2e3, 1e4, 8e1};
        Data data = new Data(axis, x, y);
        data.setDataType(Data.DATA_TYPE_LINE | Data.DATA_TYPE_MARKER);
        data.setLineColor(Color.blue);
        data.setMarkerType(Data.MARKER_TYPE_FILLED_SQUARE);
    }

    public static void main(String argv[]) {
        new SampleLogLog().setVisible(true);
    }
}
| © Visual Numerics, Inc. All rights reserved. |
|