JMSL Chart Programmer's Guide


JMSL Chart Programmer's Guide
|
Charting 3D Types >> Tube Plot |
|
Tube Plot
Lines are drawn as flat, non 3D elements. Tubes are drawn 3D versions of lines.
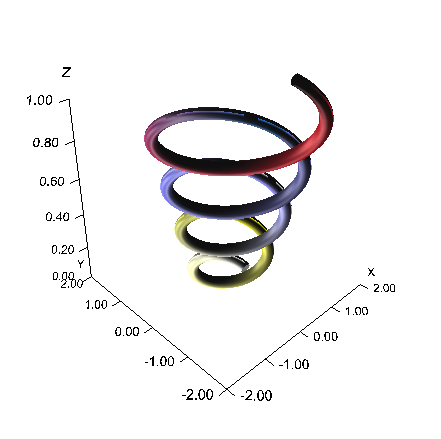
Spiral Example
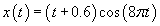
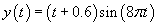
A spiral is defined by the equations parameterized by

The tube is shaded using the spectral color map from the 2D charting package.
(Download Code)import com.imsl.chart3d.*;
import java.awt.Color;
public class SampleSpiral extends JFrameChart3D implements ColorFunction {
public SampleSpiral() {
Chart3D chart = getChart3D();
AxisXYZ axis = new AxisXYZ(chart);
axis.getAxisBox().setPaint(false);
int nSpiral = 400;
double xSpiral[] = new double[nSpiral];
double ySpiral[] = new double[nSpiral];
double zSpiral[] = new double[nSpiral];
for (int i = 0; i < nSpiral; i++) {
double t = 8.0 * Math.PI * i / (double)(nSpiral-1);
double r = 0.6 + (double)i / (double)(nSpiral-1);
xSpiral[i] = r * Math.cos(t);
ySpiral[i] = r * Math.sin(t);
zSpiral[i] = (double)i / (double)(nSpiral-1);
}
Data spiral = new Data(axis, xSpiral, ySpiral, zSpiral);
spiral.setDataType(spiral.DATA_TYPE_TUBE);
spiral.setLineWidth(2);
spiral.setColorFunction(this);
render();
}
public Color color(double x, double y, double z) {
return com.imsl.chart.Colormap.SPECTRAL.color(z);
}
public static void main(String args[]) throws Exception {
new SampleSpiral().setVisible(true);
}
}
If the function is defined by a set of points, the points in the xy-plane are triangulated. The resulting 3D triangles are plotted.
| © Visual Numerics, Inc. All rights reserved. |
|