JMSL Chart Programmer's Guide


JMSL Chart Programmer's Guide
|
XML >> Examples >> Polar Plot |
|
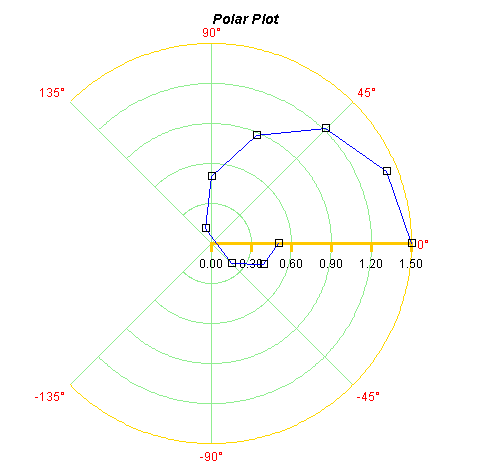
XML Example: Polar Plot
<?xml version="1.0" encoding="UTF-8" standalone="no" ?>
<!DOCTYPE Chart PUBLIC "-//Visual Numerics//DTD JMSL Chart//EN" "http://www.vni.com/products/jmsl/Chart.dtd">
<Chart>
    <ChartTitle>
        <Attribute name="Title">Polar Plot</Attribute>
        <Attribute name="FontSize" value="14"/>
        <Attribute name="FontStyle" value="3"/>
    </ChartTitle>
    <Polar>
        <Attribute name="LineColor" value="gold"/>
        <AxisR>
            <Attribute name="LineColor" value="orange"/>
            <AxisRLine>
                <Attribute name="LineWidth" value="3"/>
            </AxisRLine>
            <AxisRMajorTick>
                <Attribute name="LineWidth" value="3"/>
            </AxisRMajorTick>
        </AxisR>
        <AxisTheta>
            <Attribute name="Window" value="{-2.35619449019,2.35619449019}"/>
            <Attribute name="Number" value="7"/>
            <Attribute name="TextColor" value="red"/>
        </AxisTheta>
        <GridPolar>
            <Attribute name="LineColor" value="lightgreen"/>
        </GridPolar>
        <Data  x="{1.50,1.42,1.21,0.88,0.50,0.12,-0.21,-0.42,-0.50}"
               y="{0.00,0.39,0.79,1.18,1.57,1.96,2.36,2.75,3.14}">
            <Attribute name="LineColor" value="blue"/>
            <Attribute name="DataType" value="DATA_TYPE_LINE|DATA_TYPE_MARKER"/>
            <Attribute name="MarkerType" value="MARKER_TYPE_HOLLOW_SQUARE"/>
            <Attribute name="Title" value="Blue Line"/>
            <ToolTip/>
        </Data>
    </Polar>
</Chart>
| © Visual Numerics, Inc. All rights reserved. |
|