JMSL Chart Programmer's Guide


JMSL Chart Programmer's Guide
|
XML >> Examples >> Heatmap |
|
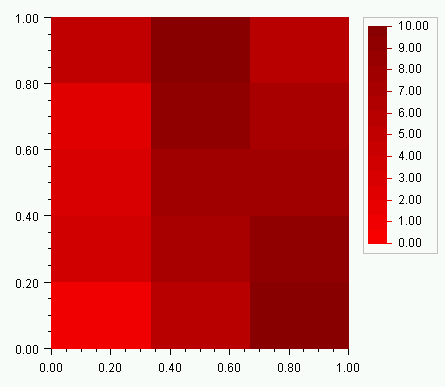
XML Example: Heatmap
(Download Code)
import com.imsl.chart.*;

public class SampleHeatmap extends JFrameChart {

    public SampleHeatmap() {
        Chart chart = getChart();
        AxisXY axis = new AxisXY(chart);
        double xmin = 0.0;
        double xmax = 5.0;
        double ymin = 0.0;
        double ymax = 4.0;
        double zmin = 0.0;
        double zmax = 100.0;
        double data[][] = {
            {23, 48, 16, 56},
            {89, 74, 54, 32},
            {12, 45, 18,  9},
            {72, 15, 42, 92},
            {63, 36, 78, 29}
        };
        Heatmap heatmap = new Heatmap(axis, xmin, xmax, ymin, ymax,
            zmin, zmax, data, Colormap.BLUE_RED);
        heatmap.getHeatmapLegend().setPaint(true);
    }

    public static void main(String argv[]) {
        new SampleHeatmap().setVisible(true);
    }
}
| © Visual Numerics, Inc. All rights reserved. |
|