JMSL Chart Programmer's Guide


JMSL Chart Programmer's Guide
|
XML >> Creating Charts from General Files Using XSLT |
|
Creating Charts from General XML Files Using XSLT
JMSL can create charts from XML files that are written using a particular set of tags, but you can also generate charts from more general XML files. This is done by using XSL Transformations (XSLT) to transform other types of XML files into the type of XML file required by JMSL.
Example
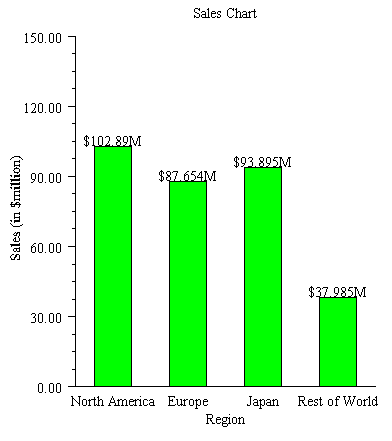
Consider the following sales report in XML that does not use the tag names and structure that JMSL requires.
<?xml version="1.0" encoding="UTF-8" ?>
<sales>
    <region>
        <name>North America</name>
        <amount>102.890</amount>
    </region>
    <region>
        <name>Europe</name>
        <amount>87.654</amount>
    </region>
    <region>
        <name>Japan</name>
        <amount>93.895</amount>
    </region>
    <region>
        <name>Rest of World</name>
        <amount>37.985</amount>
    </region>
</sales>
To create a bar chart from this XML, it must be transformed into an XML file similar to the following
<?xml version="1.0" encoding="UTF-8" ?>
<Chart>
    <Array id="amount">
        <Number>102.890</Number>
        <Number>87.654</Number>
        <Number>93.895</Number>
        <Number>37.985</Number>
    </Array>
    <Array id="region">
        <String value="North America"/>
        <String value="Europe"/>
        <String value="Japan"/>
        <String value="Rest of World"/>
    </Array>
    <Attribute name="FontName" value="Serif"/>
    <Attribute name="FontSize" value="14"/>
    <ChartTitle><Attribute name="Title" value="Sales Chart"/></ChartTitle>
    <AxisXY>
        <AxisY>
            <AxisTitle><Attribute name="Title" value="Sales (in $million)"/>
            </AxisTitle>
        </AxisY>
        <AxisX>
            <AxisTitle><Attribute name="Title" value="Region"/></AxisTitle>
        </AxisX>
        <Bar y="#amount">
           <Attribute name="BarType" value="BAR_TYPE_VERTICAL"/>
           <Attribute name="Labels" value="#region"/>
           <Attribute name="LabelType"  value="LABEL_TYPE_Y"/>
           <Attribute name="FillColor" value="green"/>
           <Attribute name="TextFormat">$###.###M</Attribute>
        </Bar>
    </AxisXY>
</Chart>
The following XSLT file can be used to perform this transformation.
<?xml version="1.0" encoding="UTF-8" ?>
<xsl:stylesheet xmlns:xsl="http://www.w3.org/1999/XSL/Transform" version="1.0">
<xsl:output method="xml" indent="yes"/>

<xsl:template match="/">
<Chart>
    <Array id="region">
        <xsl:for-each select="sales/region/name">
            <String><xsl:apply-templates/></String>
        </xsl:for-each>
    </Array>
    <Array id="amount">
        <xsl:for-each select="sales/region/amount">
            <Number><xsl:apply-templates/></Number>
        </xsl:for-each>
    </Array>
    <Attribute name="FontName" value="Serif"/>
    <Attribute name="FontSize" value="14"/>
    <ChartTitle><Attribute name="Title" value="Sales Chart"/></ChartTitle>
    <AxisXY>
        <AxisY>
            <AxisTitle>
                <Attribute name="Title" value="Sales (in $million)"/>
            </AxisTitle>
        </AxisY>
        <AxisX>
            <AxisTitle><Attribute name="Title" value="Region"/></AxisTitle>
        </AxisX>
        <Bar y="#amount">
           <Attribute name="BarType" value="BAR_TYPE_VERTICAL"/>
           <Attribute name="Labels" value="#region"/>
           <Attribute name="LabelType"  value="LABEL_TYPE_Y"/>
           <Attribute name="FillColor" value="green"/>
           <Attribute name="TextFormat">$###.###M</Attribute>
        </Bar>
    </AxisXY>
</Chart>
</xsl:template>

</xsl:stylesheet>
While a complete discussion of XSLT is beyond the scope of this manual, note that
most of the file is the same as the target. The XSL tags are in the "xsl" namespace.
In this example, the key XSL tags are the two for loops that reformat the data. For
instance, the region names are formatted by the fragment
<xsl:for-each select="sales/region/name">
   <String><xsl:apply-templates/></String>
</xsl:for-each>
where the path "sales/region/name" selects tags in the original XML file and the body of the tag
<String><xsl:apply-templates/></String>
is copied into the new file.
The given XSL document will work for similar documents with different data, but other XML document formats may require different XSL files.
The Java code required to implement this transformation is:
import com.imsl.chart.JFrameChart;
import com.imsl.chart.xml.ChartXML;
import javax.xml.parsers.DocumentBuilderFactory;
import javax.xml.parsers.DocumentBuilder;
import javax.xml.transform.TransformerFactory;
import javax.xml.transform.Transformer;
import javax.xml.transform.dom.DOMSource;
import javax.xml.transform.dom.DOMResult;
import org.w3c.dom.Document;

public class SampleSalesTransform {
    public static void main(String argv[]) throws Exception {
        String filenameXSL = argv[0];
        String filenameXML = argv[1];

        // Create an XML parser factory
        DocumentBuilderFactory factory = DocumentBuilderFactory.newInstance();
        factory.setNamespaceAware(true);
        DocumentBuilder builder = factory.newDocumentBuilder();

        // Parse the XSL file as an XML file
        Document docXSL = builder.parse(filenameXSL);
        DOMSource sourceXSL = new DOMSource(docXSL);
        sourceXSL.setSystemId(filenameXSL);

        // Create a transformation based on the XSL file
        TransformerFactory tFactory = TransformerFactory.newInstance();
        Transformer transformer = tFactory.newTransformer(sourceXSL);

        // Parse the input XML file
        Document docXML = builder.parse(filenameXML);
        DOMSource sourceXML = new DOMSource(docXML);
        sourceXML.setSystemId(filenameXML);

        // Transform the input XML file using the XSL transformer
        DOMResult result = new DOMResult();
        transformer.transform(sourceXML, result);

        // Create a chart from the transformed XML
        ChartXML chartXML = new ChartXML((Document)result.getNode());
        new JFrameChart(chartXML.getChart()).show();
    }
}
This program takes two arguments, the names of the XSL and XML files, and creates a JMSL chart. The transformed XML exists only in memory and is not written to disk. This class will work with any (correct) XSL and XML files; it is not dependent on the details of this example. In the interests of simplicity, error handling and validation is not implemented, as they should be for a production implementation.
Also, for simplicity, this example is a desktop application. XML and XSLT are generally
more useful as part of a server-side Web application. The above code can be
used with com.imsl.chart.JspBean to create a server-side XML/XSLT
solution.
| © Visual Numerics, Inc. All rights reserved. |
|