JMSL Chart Programmer's Guide


JMSL Chart Programmer's Guide
|
Charting 2D Types >> High-Low-Close Plot |
|
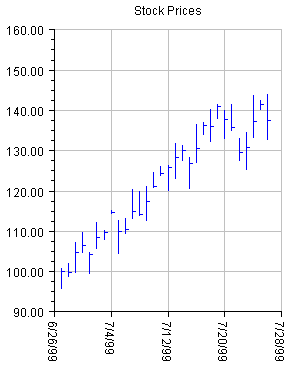
High-Low-Close Plot
High-Low-Close plots are used to show stock prices. They are created using the HighLowClose class.
The markers can be formatted using the attribute MarkerColor.
In a high-low-close plot the vertical line represents the high and low values. The close value is represented by a "tick" to the right. The open value, if present, is represented by a tick to the left.
The setupDateAxis method will configure the x-axis for dates. This turns off
autoscaling of the axis.
In a high-low-close chart the x-values are the number of milliseconds since the epoch (January 1, 1970). This is the standard Java convention for representing dates as numbers.
Example
In this example, random security prices are computed in the createData method.
The time axis is prepared by calling setDateAxis.
(Download Code)
import com.imsl.chart.*;
import java.text.DateFormat;
import java.util.*;

public class SampleHighLowClose extends JFrameChart {
    private double high[], low[], close[];

    public SampleHighLowClose() {
        Chart chart = getChart();
        AxisXY axis = new AxisXY(chart);

        // Date is June 27, 1999
        Date date = new GregorianCalendar(1999,
        GregorianCalendar.JUNE, 27).getTime();

        int n = 30;
        createData(n);

        //	 Create an instance of a HighLowClose Chart
        HighLowClose hilo = new HighLowClose(axis, date, high, low, close);
        hilo.setMarkerColor("blue");

        //	 Set the HighLowClose Chart Title
        chart.getChartTitle().setTitle("Stock Prices");

        // Setup the x axis
        Axis1D axisX = axis.getAxisX();

        //	 Set the text angle for the X axis labels
        axisX.getAxisLabel().setTextAngle(270);
        //	 Change the text format to the local date format
        DateFormat df = DateFormat.getDateInstance(DateFormat.SHORT);
        axisX.getAxisLabel().setTextFormat(df);

        // Setup the time axis
        hilo.setDateAxis("Date(SHORT)");

        // Turn on grid and make it light gray
        axisX.getGrid().setPaint(true);
        axisX.getGrid().setLineColor("lightgray");
        axis.getAxisY().getGrid().setPaint(true);
        axis.getAxisY().getGrid().setLineColor("lightgray");
    }


    private void createData(int n) {
        high = new double[n];
        low = new double[n];
        close = new double[n];
        Random r = new Random(123457);
        for (int k = 0;  k < n;  k++) {
            double f = r.nextDouble();
            if (k == 0) {
                close[0] = 100;
            } else {
                close[k] = (0.95+0.10*f)*close[k-1];
            }
            high[k] = close[k]*(1.+0.05*r.nextDouble());
            low[k] = close[k]*(1.-0.05*r.nextDouble());
        }
    }

    public static void main(String argv[]) {
        new SampleHighLowClose().setVisible(true);
    }
}
| © Visual Numerics, Inc. All rights reserved. |
|