JMSL Chart Programmer's Guide


JMSL Chart Programmer's Guide
|
XML >> Examples >> Bar Chart |
|
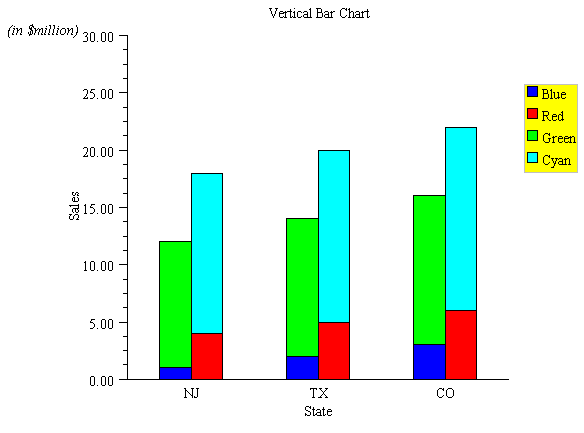
XML Example: Bar Chart
<?xml version="1.0" encoding="UTF-8" standalone="no" ?>
<!DOCTYPE Chart PUBLIC "-//Visual Numerics//DTD JMSL Chart//EN" "http://www.vni.com/products/jmsl/Chart.dtd">
<Chart>
    <Array id="foo">
        <Array>
            <Array><NumberList value="1,2,3"/></Array>
            <Array><NumberList value="4,5,6"/></Array>
        </Array>
        <Array>
            <Array><NumberList value="11,12,13"/></Array>
            <Array><NumberList value="14,15,16"/></Array>
        </Array>
    </Array>
    <Array id="states"><String value="NJ"/><String value="TX"/><String value="CO"/></Array>
    <Array id="bg"><Color value="lightblue"/><Color value="lightblue"/><Color value="yellow"/><Color value="yellow"/></Array>

    <Attribute name="FontName" value="Serif"/>
    <Attribute name="FontSize" value="14"/>
    <ChartTitle><Attribute name="Title" value="Vertical Bar Chart"/></ChartTitle>
    <Background>
        <Attribute name="Gradient" value="#bg"/>
    </Background>
    <Legend>
        <Attribute name="Paint" value="true"/>
        <Attribute name="FillColor" value="yellow"/>
        <Attribute name="FillType" value="FILL_TYPE_SOLID"/>
    </Legend>
    <AxisXY>
        <AxisY>
            <AxisTitle><Attribute name="Title" value="Sales"/></AxisTitle>
            <AxisUnit>
                <Attribute name="Title" value="(in $million)"/>
                <Attribute name="FontStyle" value="ITALIC"/>
            </AxisUnit>
        </AxisY>
        <AxisX>
            <AxisTitle><Attribute name="Title" value="State"/></AxisTitle>
        </AxisX>
        <Bar x="{0,1,2}"  y="#foo">
           <Attribute name="BarType" value="BAR_TYPE_VERTICAL"/>
            <Attribute name="Labels" value="#states"/>
            <BarSet index="{0,0}">
                <Attribute name="FillColor" value="blue"/>
                <Attribute name="Title" value="Blue"/>
            </BarSet>
            <BarSet index="{0,1}">
                <Attribute name="FillColor" value="red"/>
                <Attribute name="Title" value="Red"/>
            </BarSet>
            <BarSet index="{1,0}">
                <Attribute name="FillColor" value="green"/>
                <Attribute name="Title" value="Green"/>
            </BarSet>
            <BarSet index="{1,1}">
                <Attribute name="FillColor" value="cyan"/>
                <Attribute name="Title" value="Cyan"/>
            </BarSet>
        </Bar>
    </AxisXY>
</Chart>
| © Visual Numerics, Inc. All rights reserved. |
|