

ASA SQL User's Guide
Query Optimization and Execution
Reading access plans
There are two types of graphical plan: the graphical plan, and the graphical plan with statistics. To choose a plan type in Interactive SQL, open the Options dialog from the Tools menu, and click the Plan tab. To access the plan with SQL functions, see Accessing the Plan with SQL functions.
Once the graphical plan is displayed, you can configure the way it is displayed by right-clicking the left pane and choosing Customize.
You can print the graphical plan for later reference. To print the plan, right-click a node and choose Print.
To obtain context-sensitive help for each node in the graphical plan, select the node, right-click it and choose Help. For example, right-click Nested Loops Join and choose Help for information about the resources used by that part of the execution. There is also pop-up information that is available by hovering your cursor over each element in the graphical plan.
The graphical plan provides a great deal more information than the short or long plans. You can choose to see either the graphical plan, or the graphical plan with statistics. Both allow you to quickly view which parts of the plan have been estimated as the most expensive. The graphical plan with statistics, though more expensive to view, also provides the actual query execution statistics as monitored by the server when the query is executed, and permits direct comparison between the estimates used by the query optimizer in constructing the access plan with the actual statistics monitored during execution. Note, however, that the optimizer is often unable to precisely estimate a query's cost, so expect there to be differences. The graphical plan is the default format for access plans.
The graphical plan is designed to provide some key information visually:
Each operation displayed in the graphical plan is displayed in a container. The container indicates whether the operation materializes data, whether it is an index scan, whether it is a table scan, or whether it is some other operation.
The number of rows that an operation passes to the next operation in the plan is indicated by the thickness of the line joining the operations. This provides a visual indicator of the operations carried out on most data in the query.
The container for an operation that is particularly slow is given a red border.
Each of these display features is customizable.
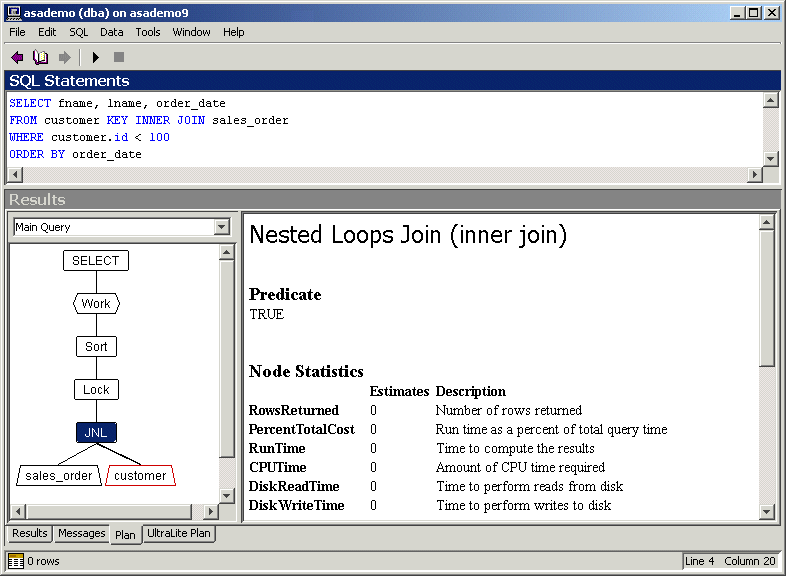
Following is the same query that was used to describe the short and long text plans, presented with the graphical plan. The diagram is in the form of a tree, indicating that each node requests rows from the nodes beneath it. The Lock node indicates that the result set is materialized, or that a row is returned to an application. In this case, the sort requires that results are materialized. At level 0, rows aren't really locked: Adaptive Server Anywhere just ensures that the row has not been deleted since it was read from the base tables. At level 1, a row is locked only until the next row is accessed. At levels 2 and 3, read locks are applied and held until COMMIT.
You can obtain detailed information about the nodes in the plan by clicking the node in the graphical diagram. In this example, the nested loops join node is selected. The information in the right pane pertains only to that node.

For more information about abbreviations used in the plan, see Abbreviations used in the plan.
The graphical plan with statistics shows you all the estimates that are provided with the graphical plan, but also shows actual runtime costs of executing the statement. To do this, the statement must actually be executed. This means that there may be a delay in accessing the plan for expensive queries. It also means that any parts of your query such as deletes or updates are actually executed, although you can perform a rollback to undo these changes.
Use the graphical plan with statistics when you are having performance problems, and the estimated row count or run time differs from your expectations. The graphical plan with statistics provides estimates and actual statistics for you to compare. A large difference between actual and estimate is a warning sign that the optimizer might not have sufficient information to prepare correct estimates.
The database options and other global settings that affect query execution are displayed for the root operator only.
Following are some of the key statistics you can check in the graphical plan with statistics, and some possible remedies:
Row count actuals and estimates Row count measures the rows in the result set. If the estimated row count is significantly different from the actual row count, the selectivity is probably incorrect.
Selectivity actuals and estimates Accurate selectivity estimates are critical for the proper operation of the query optimizer. For example, if the optimizer mistakenly estimates a predicate to be highly selective (with, say, a selectivity of 5%), but the actual selectivity is much lower (for example, 50%), then performance may suffer. In general, estimates will not be precise. However, a significantly large error does indicate a possible problem. If the predicate is over a base column for which there does not exist a histogram, executing a CREATE STATISTICS statement to create a histogram may correct the problem. If selectivity error remains a problem then, as a last resort, you may wish to consider specifying a user estimate of selectivity along with the predicate in the query text.
For more information about selectivity, see Selectivity in the plan.
For more information about creating statistics, see CREATE STATISTICS statement.
For more information about user estimates, see Explicit selectivity estimates.
Runtime actuals and estimates Runtime measures the time to execute the query. If the runtime is incorrect for a table scan or index scan, you may improve performance by executing the REORGANIZE TABLE statement.
For more information, see REORGANIZE TABLE statement.
Estimate source When the source of the estimate is Guess, the optimizer has no information to use, which may indicate a problem. If the estimate source is Index and the selectivity estimate is incorrect, your problem may be that the index is skewed: you may benefit from defragmenting the index with the REORGANIZE TABLE statement.
For a complete list of the possible sources of selectivity estimates, see ESTIMATE_SOURCE function [Miscellaneous].
Cache reads and hits If the number of cache reads and cache hits are exactly the same, then your entire database is in cache—an excellent thing. When reads are greater than hits, it means that the server is attempting to go to cache but failing, and that it must read from disk. In some cases, such as hash joins, this is expected. In other cases, such as nested loops joins, a poor cache-hit ratio may indicate a performance problem, and you may benefit from increasing your cache size.
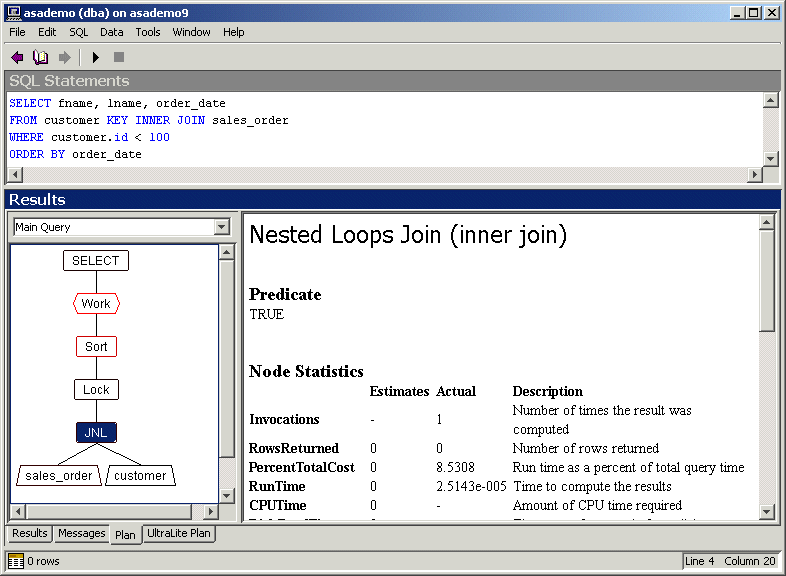
Following is an example of the graphical plan with statistics. Again, the nested loops join node is selected. The statistics in the right pane indicate the resources used by that part of the query.

For more information about code words used in the plan, see Abbreviations used in the plan.
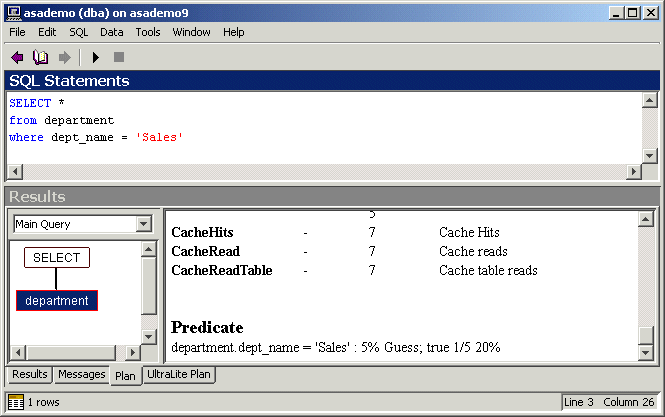
Following is an example of the Predicate showing selectivity of a search condition. In this example, the Filter node is selected, and the statistics pane shows the Predicate as the search condition and selectivity statistics.

This predicate is
department.dept_name = 'Sales' : 20% COLUMN
This can be read as follows:
department.dept_name = 'Sales' is the search condition.
20% is the optimizer's estimate of the selectivity. This is the same output as is provided by the ESTIMATE function. For more information, see ESTIMATE function [Miscellaneous].
The source of the estimate is COLUMN. This is the same output as is provided by the ESTIMATE_SOURCE function. For a complete list of the possible sources of selectivity estimates, see ESTIMATE_SOURCE function [Miscellaneous].
Note: If you select the graphical plan, but not the graphical plan with statistics, the final two statistics are not displayed. |


