JMSL Chart Programmer's Guide


JMSL Chart Programmer's Guide
|
2D Drawing Elements >> AxisXY >> Custom Transform |
|
Custom Transform
A custom transformation allows a user-defined mapping of data to an axis. A custom transform is used when the Transform attribute has the value TRANSFORM_CUSTOM. The custom transform is the value of the CustomTransform attribute.
A custom transform implements the Transform interface. This interface has three
methods. One, setupMapping, is called first to allow the transformation to initialize
itself. The other two, mapUserToUnit and mapUnitToUser, specify a
mapping from the window interval onto [0,1]. These methods must each be the
inverse of the other.
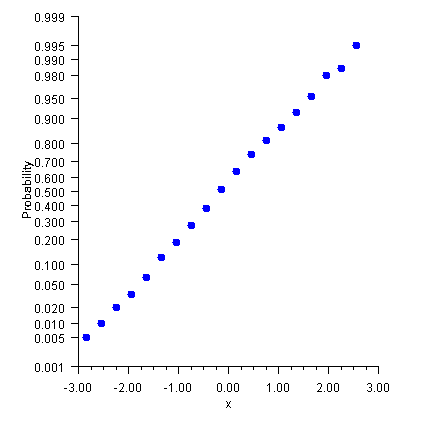
Example: Normal Probability Plot
A normal probability plot maps normally distributed data into a straight line, just as a semilog plot maps exponential data into a straight line.
In this example, 400 normally distributed random numbers are grouped into 20 bins. The bin counts are normalized by dividing by the number of samples (400). Cumulative probabilities are computed by summing the probabilities in all of the bins to the left of the current bin.
The custom transformation is the normal cumulative distribution function,
Cdf.normal, and its inverse, Cdf.inverseNormal, scaled to map the probability
range [0.001,0.999] onto [0,1].
Autoscaling is turned off on the probability (y) axis and a fixed set of probability tick marks are specified.
The plot is of the bin center on the x-axis versus the cumulative probabilities on the y-axis. The points are not in an exactly straight line because with only a finite number of samples, the distribution does not exactly match the normal distribution.
(Download Code)
import com.imsl.chart.*;
import com.imsl.stat.Cdf;
import com.imsl.stat.Random;
import java.awt.Color;

public class SampleProbability extends JFrameChart {

    public SampleProbability() {
        Chart chart = getChart();
        AxisXY axis = new AxisXY(chart);

        double ticks[] = {0.001, 0.005, 0.01, 0.02, 0.05, 0.10, 0.20, 0.30,
            0.40, 0.50, 0.60, 0.70, 0.80, 0.90, 0.95, 0.98, 0.99, 0.995, 0.999};
        double a = ticks[0];
        double b = ticks[ticks.length-1];

        axis.getAxisX().getAxisTitle().setTitle("x");
        axis.getAxisY().getAxisTitle().setTitle("Probability");

        axis.getAxisY().setTransform(axis.TRANSFORM_CUSTOM);
        axis.getAxisY().setCustomTransform(new NormalTransform());
        axis.getAxisY().setAutoscaleInput(axis.AUTOSCALE_OFF);
        axis.getAxisY().setWindow(a, b);
        axis.getAxisY().setTextFormat(new java.text.DecimalFormat("0.000"));
        axis.getAxisY().setTicks(ticks);
        axis.getAxisY().getMinorTick().setPaint(false);

        int nSamples = 400;
        int nBins = 20;

        // Setup the bins
        double bins[] = new double[nBins];
        double dx = 6.0/nBins;
        double x[] = new double[nBins];
        for (int k = 0;  k < nBins;  k++) {
            x[k] = -3.0 + (k+0.5)*dx;
        }

        // Generate random normal deviates and sort into bins
        Random r = new Random(123457);
        for (int k = 0;  k < nSamples;  k++) {
            double t = r.nextNormal();
            int j = (int)Math.round((t+3.0-0.5*dx)/dx);
            if (j <= 0) {
                bins[0]++;
            } else if (j >= nBins-1) {
                bins[nBins-1]++;
            } else {
                bins[j]++;
            }
        }

        // Compute the cumulative distribution
        // y[k] is the sum of bins[j] for j=0,...,k divided by the nSamples.
        double y[] = new double[nBins];
        y[0] = bins[0]/nSamples;
        for (int k = 1;  k < nBins;  k++) {
            y[k] = y[k-1] + bins[k]/nSamples;
        }

        // Plot the data using markers
        Data data = new Data(axis, x, y);
        data.setDataType(Data.DATA_TYPE_MARKER);
        data.setMarkerType(Data.MARKER_TYPE_FILLED_CIRCLE);
        data.setMarkerColor(Color.blue);
    }


    public static void main(String argv[]) {
        new SampleProbability().setVisible(true);
    }


    static class NormalTransform implements Transform {
        private double scaleA, scaleB;

        /**
         *	 Initializes the mappings between user and coordinate space.
         */
        public void setupMapping(Axis1D axis1d) {
            double w[] = axis1d.getWindow();
            double t = Cdf.inverseNormal(w[0]);
            scaleB = 1.0/(Cdf.inverseNormal(w[1])-t);
            scaleA = -scaleB*t;
        }

        /**
         * Maps a point in [0,1] to a probability.
         */
        public double mapUnitToUser(double unit) {
            return Cdf.normal((unit-scaleA)/scaleB);
        }

        /**
         * Maps a probablity to the interval [0,1].
         */
        public double mapUserToUnit(double p) {
            return scaleA + scaleB*Cdf.inverseNormal(p);
        }
    }
}
| © Visual Numerics, Inc. All rights reserved. |
|