JMSL Chart Programmer's Guide


JMSL Chart Programmer's Guide
|
2D Drawing Elements >> AxisXY >> Grid |
|
Grid
The Grid node controls the drawing of grid lines on a chart. The Grid is created by
Axis1D as its child. It can be retrieved using the method Axis1D.getGrid().
By default, Grid nodes are not drawn. To enable them, set their "Paint" attribute to
true. Grid nodes control the drawing of the grid lines perpendicular to their parent
axis. So the x-axis Grid node controls the drawing of the vertical grid lines.
Example
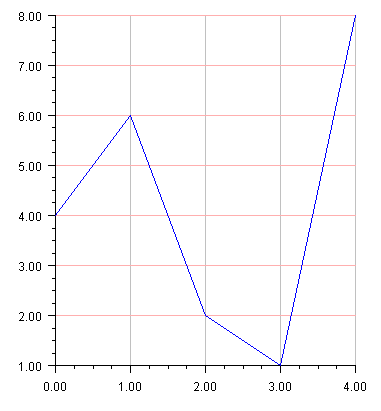
In this example, the x-axis grid lines are painted light gray and the y-axis grid lines are pink.
import com.imsl.chart.*;

public class SampleGrid extends JFrameChart {

    public SampleGrid() {
        Chart chart = getChart();
        AxisXY axis = new AxisXY(chart);

        axis.getAxisX().getGrid().setPaint(true);
        axis.getAxisY().getGrid().setPaint(true);
        axis.getAxisX().getGrid().setLineColor("lightgray");
        axis.getAxisY().getGrid().setLineColor("pink");

        double y[] = {4, 6, 2, 1, 8};
        Data data = new Data(axis, y);
        data.setDataType(Data.DATA_TYPE_LINE);
        data.setLineColor("blue");
    }

    public static void main(String argv[]) {
        new SampleGrid().setVisible(true);
    }
}
| © Visual Numerics, Inc. All rights reserved. |
|