JMSL Chart Programmer's Guide


JMSL Chart Programmer's Guide
|
Charting 2D Types >> Histogram |
|
Histogram
A histogram is a bar chart in which the height of the bars is proportional to the frequencies. A histogram generally uses the same axis style as a scatter plot (i.e. the bars are numbered not labeled.)
In JMSL, histograms are drawn using the Bar class, but its setLabels method is
not used.
Example
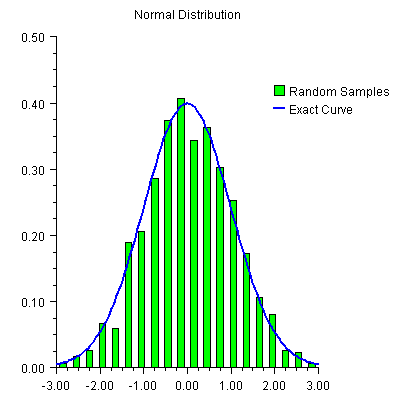
In this example normally distributed random numbers are generated and placed
into 20 uniformly sized bins in the interval [-3,3]. Points outside of this interval are
ignored. The bins counts are scaled by the number of samples and the bin width.
The scaled bin counts are charted using Bar chart. The exact normal distribution is
implemented as a ChartFunction and plotted.
The legend is displayed by setting the legend node's Paint attribute to true and
defining the bar chart's Title attribute. The legend is positioned on the chart by setting
its Viewport attribute.
import com.imsl.math.Sfun;
import com.imsl.stat.Random;
import com.imsl.chart.*;
import java.awt.*;
import javax.swing.*;

public class SampleHistogram extends JFrameChart {

    public SampleHistogram() {
        int nSamples = 1000;
        int nBins = 20;

        // Setup the bins
        double bins[] = new double[nBins];
        double dx = 6.0/nBins;
        double x[] = new double[nBins];
        for (int k = 0;  k < nBins;  k++) {
            x[k] = -3.0 + (k+0.5)*dx;
        }

        Random r = new Random(123457);
        for (int k = 0;  k < nSamples;  k++) {
            double t = r.nextNormal();
            int j = (int)Math.round((t+3.0-0.5*dx)/dx);
            if (j >= 0  &&  j < nBins)  bins[j]++;
        }

        // Scale the bins
        for (int k = 0;  k < nBins;  k++) {
            bins[k] /= nSamples*dx;
        }

        // create the chart
        Chart chart = getChart();
        AxisXY axis = new AxisXY(chart);

        chart.getChartTitle().setTitle("Normal Distribution");
        chart.getLegend().setPaint(true);
        chart.getLegend().setViewport(0.7, 1.0, 0.2, 0.3);
        chart.getLegend().setFillOutlineType(chart.FILL_TYPE_NONE);

        Bar bar = new Bar(axis, x, bins);
        bar.setBarType(bar.BAR_TYPE_VERTICAL);
        bar.setFillColor(Color.green);
        bar.setBarWidth(0.5*dx);
        bar.setTitle("Random Samples");

        // plot the expected curve
        ChartFunction f = new ChartFunction() {
            public double f(double x) {
                return Math.exp(-0.5*x*x)/Math.sqrt(2.0*Math.PI);
            }
        };
        Data data = new Data(axis, f, -3, 3.0);
        data.setLineColor(Color.blue);
        data.setTitle("Exact Curve");
        data.setLineWidth(2.0);
    }

    public static void main(String argv[]) {
        new SampleHistogram().setVisible(true);
    }
}
| © Visual Numerics, Inc. All rights reserved. |
|