JMSL Chart Programmer's Guide


JMSL Chart Programmer's Guide
|
Charting 2D Types >> Polar Plot |
|
Polar Plot
The class Polar is used to plot (r,theta) data, where r is the distance from the
origin and theta is the angle from the positive x-axis. Data node (x,y) values are
treated as if they were (r,theta) values.
When a Polar node is created, a subtree of other nodes is created. These automatically created nodes are shown in the following diagram.
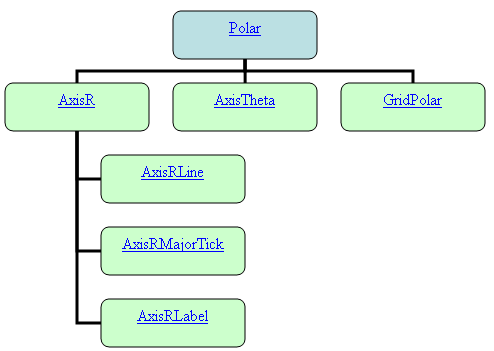
AxisR is the r-axis node. This is drawn along the positive x-axis. This node has
three subnodes: AxisRLine for the actual line, AxisRMajorTick for the tick
marks along the line and AxisRLabel for the tick mark labels.
The drawing of the AxisRLine and the AxisRMajorTick is controlled by the
Line Attributes. The drawing of the AxisRLabel is controlled by the Text
Attributes.
The Window attribute in AxisR specifies the length of the r-axis. Since the r-axis
range is [0,rmax], the Window attribute for this node is the rmax value. Autoscaling
is used to automatically determine rmax from the data. Autoscaling can be turned
off. See Autoscale for more details.
AxisTheta is the theta-axis node. It is drawn as a circle around the plot. The drawing of the circle itself is controlled by the line attributes. The drawing of the axis labels is controlled by the text attributes.
The Window attribute in the AxisTheta node contains the angular range, in radians.
Its default value is [0,2p]. The Window attribute can be explicitly set to change
the range, but autoscaling is not available to determine the angular range.
GridPolar is the plot grid. It consists of both radial and circular lines. The drawing of these lines is controlled by the line attributes. By default, these lines are drawn and are light gray.
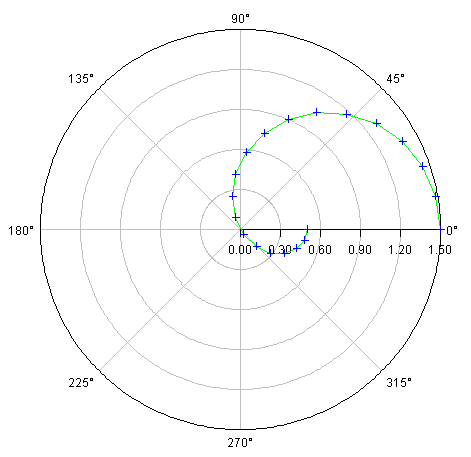
Example
The function r = 0.5 + cos(theta), for 0 <= theta <= p is plotted.
import com.imsl.chart.*;
import java.awt.Color;

public class SamplePolar extends JFrameChart {

    public SamplePolar() {
        Chart chart = getChart();
        Polar axis = new Polar(chart);

        double r[] = new double[20];
        double theta[] = new double[r.length];
        for (int k = 0;  k < r.length;  k++) {
            theta[k] = Math.PI*k/(r.length-1);
            r[k] = 0.5 + Math.cos(theta[k]);
        }
        Data data = new Data(axis, r, theta);
        data.setDataType(Data.DATA_TYPE_MARKER | Data.DATA_TYPE_LINE);
        data.setLineColor(Color.green);
        data.setMarkerColor(Color.blue);
    }

    public static void main(String argv[]) {
        new SamplePolar().setVisible(true);
    }
}
| © Visual Numerics, Inc. All rights reserved. |
|