JMSL Chart Programmer's Guide


JMSL Chart Programmer's Guide
|
Charting 2D Types >> Contour Chart |
|
Contour Chart
A Contour chart shows level curves of a two-dimensional function.
Example
The JFrameChart class is used to create a frame containing a Chart node. A Contour node is then created as a child of the Chart node. The Contour node constructor creates ContourLevel nodes as its children. The number of ContourLevel nodes created is equal to the number of contour levels plue one, here equal to 4. After the ContourLevel nodes are created they are retrieved from the object pie and customized by setting attributes.
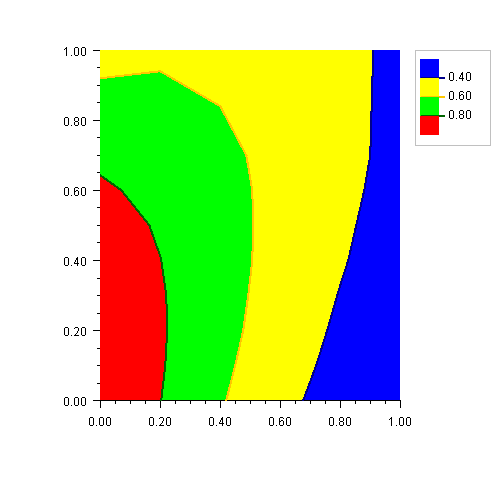
The FillColor and LineColor attributes are set in each level. This determines the color of the fill area for the level and the color of the level curves. Since the default value of FillColor is black, it is generally recommended that FillColor be set in each level.
Each level corresponds to the area less than or equal to the contour level value and greater than the previous level, if any. So in this example, since the 0-th level value is 0.4, the area where the function is less than 0.4 is filled with blue (the level-0 fill color) and the level curve equal to 0.4 is draw with dark blue, the level-0 line color.
| © Visual Numerics, Inc. All rights reserved. |
|