JMSL Chart Programmer's Guide


JMSL Chart Programmer's Guide
|
Charting 2D Types >> Bar Chart |
|
Bar Chart
The class Bar is used to create bar charts and histograms. This page describes the construction of labeled bar charts. For a discussion of histograms, see Histogram.
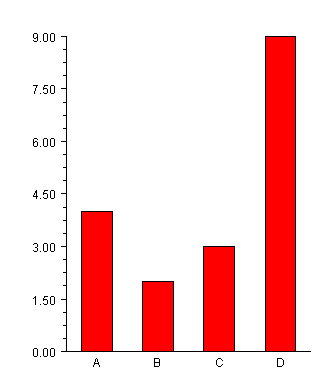
Simple Bar Chart
The following code creates this labeled bar chart. The BarType attribute can be
either BAR_TYPE_VERTICAL or BAR_TYPE_HORIZONTAL. The method
setLabels sets the bar labels and adjusts the attributes of the axis to be appropriate
for bar labels. The setLabels method must be called after the setBarType
method, so that the correct axis has its attributes adjusted.
The drawing of the bars is controlled by the FillType and FillOutlineType attributes. By default FillType has the value FILL_TYPE_SOLID, so setting the associated attribute FillColor to red causes solid red bars to be drawn.
import com.imsl.chart.*;
import java.awt.Color;

public class SampleBar extends JFrameChart {

    public SampleBar() {
        Chart chart = getChart();
        AxisXY axis = new AxisXY(chart);
        double y[] = {4, 2, 3, 9};
        Bar bar = new Bar(axis, y);
        bar.setBarType(Bar.BAR_TYPE_VERTICAL);
        bar.setLabels(new String[]{"A","B","C","D"});
        bar.setFillColor(Color.red);
    }

    public static void main(String argv[]) {
        new SampleBar().setVisible(true);
    }
}
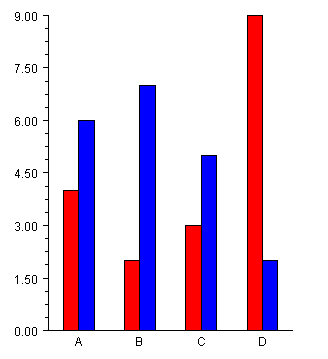
Grouped Bar Chart
In a grouped bar chart multiple sets of data are displayed as side-by-side bars.
The data argument to the constructor for a grouped bar chart is an nGroups by
nItems array of doubles. In this example there are two groups, each containing
four items. All of the groups must contain the same number of items.
The getBarSet(int) method returns a BarSet object that is a collection of the
BarItems that make up a given group. Here the bars in group 0 are set to red and
those in group 1 are set to blue.
import com.imsl.chart.*;
import java.awt.Color;

public class SampleBarGroup extends JFrameChart {

    public SampleBarGroup() {
        Chart chart = getChart();
        AxisXY axis = new AxisXY(chart);
        double y[][] = {{4,2,3,9},{6,7,5,2}};
        Bar bar = new Bar(axis, y);
        bar.setBarType(Bar.BAR_TYPE_VERTICAL);
        bar.setLabels(new String[]{"A","B","C","D"});
        bar.getBarSet(0).setFillColor(Color.red);
        bar.getBarSet(1).setFillColor(Color.blue);
    }

    public static void main(String argv[]) {
        new SampleBarGroup().setVisible(true);
    }
}
In the above SampleBarGroup example, the Bar constructor creates a collection of chart nodes. For each group, it creates a BarSet node as its direct child. Each BarSet node has BarItem nodes as children, one for each bar in the set.
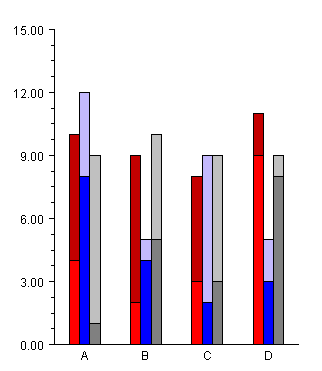
Stacked Grouped Bar Chart
The most general form of the bar chart is a stacked, grouped bar chart.
The data argument to the constructor for a stacked, grouped bar chart is an
nStacks by nGroups by nItems array of doubles. In this example there are two
stacks in three groups each containing four items. All of the stacks must contain the
same number of groups and all of the groups must contain the same number of
items.
The getBarSet(int,int) method returns a BarSet object that is a collection of
the BarItems that make up a given stack/group. Here within each group the stacks
are set to shades of the same color.
A stacked bar chart, without groups, can be constructed as a stacked-grouped bar chart with one group.
import com.imsl.chart.*;
import java.awt.Color;

public class SampleBarGroupStack extends JFrameChart {
    static final Color darkRed = new Color(196,0,0);
    static final Color lightBlue = new Color(196,185,253);

    public SampleBarGroupStack() {
        Chart chart = getChart();
        AxisXY axis = new AxisXY(chart);
        // y is a 2 by 3 by 4 array
        double y[][][] = {
            {{4,2,3,9},{8,4,2,3},{1,5,3,8}},
            {{6,7,5,2},{4,1,7,2},{8,5,6,1}}
        };
        Bar bar = new Bar(axis, y);
        bar.setBarType(Bar.BAR_TYPE_VERTICAL);
        bar.setLabels(new String[]{"A","B","C","D"});
        // group 0 - shades of red
        bar.getBarSet(0,0).setFillColor(Color.red);
        bar.getBarSet(1,0).setFillColor(darkRed);
        // group 1 - shades of blue
        bar.getBarSet(0,1).setFillColor(Color.blue);
        bar.getBarSet(1,1).setFillColor(lightBlue);
        // group 2 - shades of gray
        bar.getBarSet(0,2).setFillColor(Color.gray);
        bar.getBarSet(1,2).setFillColor(Color.lightGray);
    }

    public static void main(String argv[]) {
        new SampleBarGroupStack().setVisible(true);
    }
}
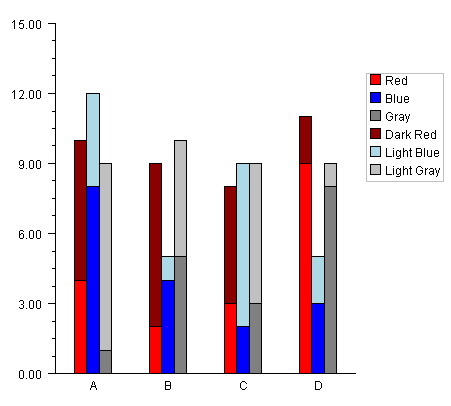
Legend
The Legend for a bar chart is turned on by setting the Legend's Paint attribute to
true and defining the Title attributes for the legend entries. The legend entries are
the BarSet objects. The following example is the stacked, grouped bar example
with the legend enabled.
import com.imsl.chart.*;
import java.awt.Color;

public class SampleBarLegend extends JFrameChart {
    public SampleBarLegend() {
        Chart chart = getChart();
        AxisXY axis = new AxisXY(chart);
        chart.getLegend().setPaint(true);
        // y is a 2 by 3 by 4 array
        double y[][][] = {
            {{4,2,3,9},{8,4,2,3},{1,5,3,8}},
            {{6,7,5,2},{4,1,7,2},{8,5,6,1}}
        };
        Bar bar = new Bar(axis, y);
        bar.setBarType(Bar.BAR_TYPE_VERTICAL);
        bar.setLabels(new String[]{"A","B","C","D"});
        // group 0 - shades of red
        bar.getBarSet(0,0).setTitle("Red");
        bar.getBarSet(0,0).setFillColor("Red");
        bar.getBarSet(1,0).setTitle("Dark Red");
        bar.getBarSet(1,0).setFillColor("DarkRed");
        // group 1 - shades of blue
        bar.getBarSet(0,1).setTitle("Blue");
        bar.getBarSet(0,1).setFillColor("Blue");
        bar.getBarSet(1,1).setTitle("Light Blue");
        bar.getBarSet(1,1).setFillColor("LightBlue");
        // group 2 - shades of gray
        bar.getBarSet(0,2).setTitle("Gray");
        bar.getBarSet(0,2).setFillColor("Gray");
        bar.getBarSet(1,2).setTitle("Light Gray");
        bar.getBarSet(1,2).setFillColor("LightGray");
    }

    public static void main(String argv[]) {
        new SampleBarLegend().setVisible(true);
    }
}
Attribute BarGap
The BarGap attribute sets the gap between bars in a group. A gap of 1.0 means that space between bars is the same as the width of an individual bar in the group. Its default value is 0.0, meaning there is no space between groups.
Attribute BarWidth
The BarWidth attribute sets the width of the groups of bars at each index. Its default value is 0.5. If the number of groups is increased, the width of each individual bar is reduced proportionately.
See Histogram for an example of the use of the BarWidth attribute.
| © Visual Numerics, Inc. All rights reserved. |
|