JMSL Chart Programmer's Guide


JMSL Chart Programmer's Guide
|
Charting 2D Types >> Scatter Plot |
|
Scatter Plot
This section describes the construction of scatter charts. The markers can be formatted using the Marker Attributes.
It is also possible to mix lines and markers (see Mixed Line and Marker Plot).
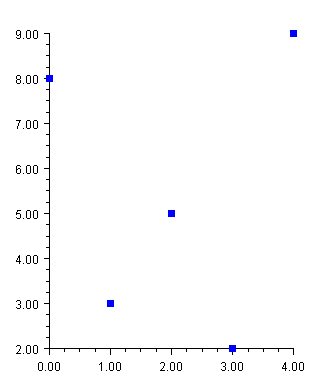
Simple Scatter Plot
The JFrameChart class is used to create a frame containing a Chart node. The
Chart node is the root of the tree to which an AxisXY node is added. A Data node
is then created as the child of the axis node. The Data node is created using an array
of y-values. The x-values default to 0, 1, ....
The DataType attribute is set to DATA_TYPE_MARKER to make this a scatter plot.
The look of the markers is controlled by the marker attributes. In this example the MarkerType attribute is set to MARKER_TYPE_FILLED_SQUARE. The MarkerColor attribute is set to blue (to view plot in color see online documentation).
import com.imsl.chart.*;
import java.awt.Color;

public class SampleSimpleScatter extends JFrameChart {

    public SampleSimpleScatter() {
        Chart chart = getChart();
        AxisXY axis = new AxisXY(chart);

        double y[] = {8, 3, 5, 2, 9};
        Data data1 = new Data(axis, y);
        data1.setDataType(Data.DATA_TYPE_MARKER);
        data1.setMarkerType(Data.MARKER_TYPE_FILLED_SQUARE);
        data1.setMarkerColor(Color.blue);
    }

    public static void main(String argv[]) {
        new SampleSimpleScatter().setVisible(true);
    }
}
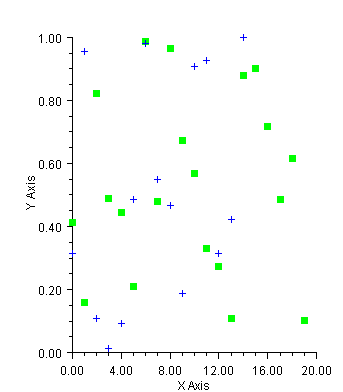
Complex Scatter Plot
This example shows a scatter plot with two data sets. The Data nodes are created using random y-values generated by Random. The x-values default to 0, 1, ....
The axes are labeled by setting the AxisTitle attribute for the x and y axes.
The DataType attribute is set in the axis node. The axis node does not itself use this attribute, but from there it is inherited by the child Data nodes.
(Download Code)
import com.imsl.chart.*;
import java.awt.Color;
import com.imsl.stat.Random;

public class SampleScatter extends JFrameChart {

    public SampleScatter() {
        Random r = new Random(123457);

        Chart chart = getChart();
        AxisXY axis = new AxisXY(chart);
        axis.getAxisX().getAxisTitle().setTitle("X Axis");
        axis.getAxisY().getAxisTitle().setTitle("Y Axis");
        axis.setDataType(Data.DATA_TYPE_MARKER);

        // Data set 1
        double y1[] = new double[20];
        for (int k = 0;  k < y1.length;  k++)  y1[k] = r.nextDouble();
        Data data1 = new Data(axis, y1);
        data1.setDataType(Data.DATA_TYPE_MARKER);
        data1.setMarkerType(Data.MARKER_TYPE_FILLED_SQUARE);
        data1.setMarkerColor(Color.green);

        // Data set 2
        double y2[] = new double[15];
        for (int k = 0;  k < y2.length;  k++)  y2[k] = r.nextDouble();
        Data data2 = new Data(axis, y2);
        data2.setMarkerType(Data.MARKER_TYPE_PLUS);
        data2.setMarkerColor(Color.blue);
    }

    public static void main(String argv[]) {
        new SampleScatter().setVisible(true);
    }
}
| © Visual Numerics, Inc. All rights reserved. |
|