JMSL Chart Programmer's Guide


JMSL Chart Programmer's Guide
|
XML >> Examples >> Axis Titles |
|
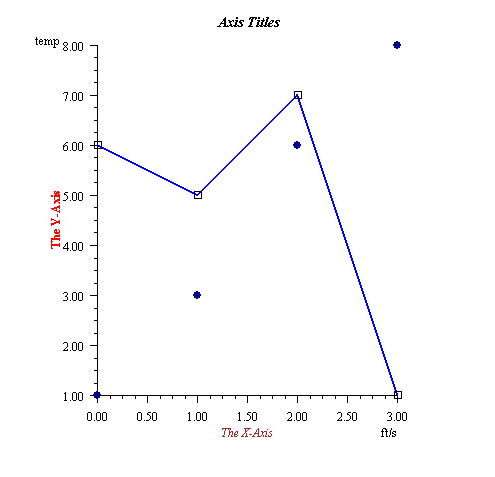
XML Example: Axis Titles
<?xml version="1.0" encoding="UTF-8" standalone="no" ?>
<!DOCTYPE Chart PUBLIC "-//Visual Numerics//DTD JMSL Chart//EN" "http://www.vni.com/products/jmsl/Chart.dtd">
<Chart>
    <Attribute name="FontName" value="Serif"/>
    <ChartTitle>
        <Attribute name="Title">Axis Titles</Attribute>
        <Attribute name="FontSize" value="14"/>
        <Attribute name="FontStyle" value="3"/>
    </ChartTitle>
    <AxisXY>
        <AxisX>
            <AxisTitle>
                <Attribute name="Title" value="The X-Axis"/>
                <Attribute name="TextColor" value="brown"/>
                <Attribute name="FontStyle" value="ITALIC"/>
            </AxisTitle>
            <AxisUnit><Attribute name="Title" value="ft/s"/></AxisUnit>
        </AxisX>
        <AxisY>
            <AxisTitle>
                <Attribute name="Title" value="The Y-Axis"/>
                <Attribute name="TextColor" value="red"/>
                <Attribute name="FontStyle" value="BOLD"/>
            </AxisTitle>
            <AxisUnit><Attribute name="Title" value="temp"/></AxisUnit>
        </AxisY>
        <Data y="{6,5,7,1}">
            <Attribute name="LineColor" value="blue"/>
            <Attribute name="LineWidth" value="2.0"/>
            <Attribute name="DataType" value="DATA_TYPE_LINE|DATA_TYPE_MARKER"/>
            <Attribute name="MarkerType" value="MARKER_TYPE_HOLLOW_SQUARE"/>
        </Data>
        <Data y="{1,3,6,8}">
            <Attribute name="MarkerColor" value="darkblue"/>
            <Attribute name="DataType" value="DATA_TYPE_MARKER"/>
            <Attribute name="MarkerType" value="MARKER_TYPE_FILLED_CIRCLE"/>
        </Data>
    </AxisXY>
</Chart>
| © Visual Numerics, Inc. All rights reserved. |
|