JMSL Chart Programmer's Guide


JMSL Chart Programmer's Guide
|
XML >> Examples >> Multiple Axes |
|
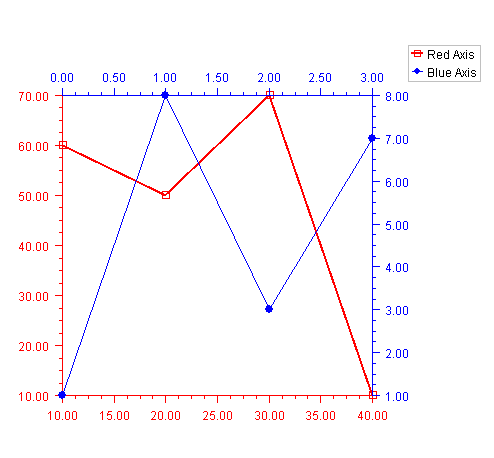
XML Example: Multiple Axes
(Download Code)
<?xml version="1.0" encoding="UTF-8" standalone="no" ?>
<!DOCTYPE Chart PUBLIC "-//Visual Numerics//DTD JMSL Chart//EN" "http://www.vni.com/products/jmsl/Chart.dtd">
<Chart>
    <Legend>
        <Attribute name="Paint" value="true"/>
        <Attribute name="Viewport" value="0.83,1.0,0.1,0.3"/>
    </Legend>
    <AxisXY>
        <Attribute name="Viewport" value="0.13,0.75,0.2,0.8"/>
        <Attribute name="LineColor" value="red"/>
        <Attribute name="MarkerColor" value="red"/>
       <Attribute name="TextColor" value="red"/>
        <Data x="10,20,30,40" y="60,50,70,10">
            <Attribute name="LineWidth" value="2.0"/>
            <Attribute name="DataType" value="DATA_TYPE_LINE|DATA_TYPE_MARKER"/>
            <Attribute name="MarkerType" value="MARKER_TYPE_HOLLOW_SQUARE"/>
            <Attribute name="Title" value="Red Axis"/>
            <ToolTip/>
        </Data>
    </AxisXY>
    <AxisXY>
        <Attribute name="Viewport" value="0.13,0.75,0.2,0.8"/>
        <Attribute name="LineColor" value="blue"/>
        <Attribute name="MarkerColor" value="blue"/>
       <Attribute name="TextColor" value="blue"/>
        <AxisX>
            <Attribute name="Type" value="AXIS_X_TOP"/>
        </AxisX>
        <AxisY>
            <Attribute name="Type" value="AXIS_Y_RIGHT"/>
        </AxisY>
        <Data y="1,8,3,7">
            <Attribute name="DataType" value="DATA_TYPE_LINE|DATA_TYPE_MARKER"/>
            <Attribute name="MarkerType" value="MARKER_TYPE_FILLED_CIRCLE"/>
            <Attribute name="Title" value="Blue Axis"/>
            <ToolTip/>
        </Data>
    </AxisXY>
</Chart>
| © Visual Numerics, Inc. All rights reserved. |
|