JMSL Chart Programmer's Guide


JMSL Chart Programmer's Guide
|
XML >> Examples >> Rotated Labels |
|
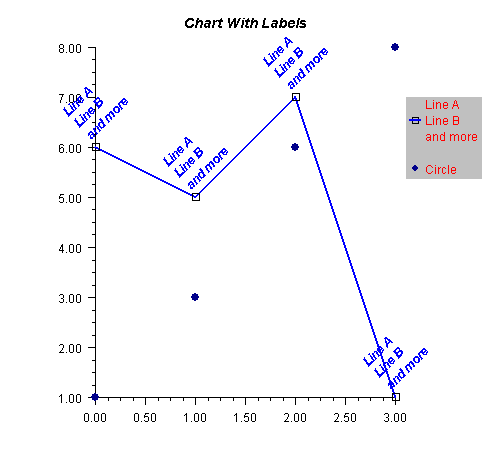
XML Example: Rotated Labels
<?xml version="1.0" encoding="UTF-8" standalone="no" ?>
<!DOCTYPE Chart PUBLIC "-//Visual Numerics//DTD JMSL Chart//EN" "http://www.vni.com/products/jmsl/Chart.dtd">
<Chart>
    <ChartTitle>
        <Attribute name="Title">Chart With Labels</Attribute>
        <Attribute name="FontSize" value="14"/>
        <Attribute name="FontStyle" value="3"/>
    </ChartTitle>
    <Legend>
        <Attribute name="Paint" value="true"/>
        <Attribute name="TextColor" value="red"/>
        <Attribute name="FillType" value="FILL_TYPE_SOLID"/>
    </Legend>
    <AxisXY>
        <Attribute name="ClipData" value="false"/>
        <Data y="{6,5,7,1}">
            <Attribute name="LabelType" value="LABEL_TYPE_TITLE"/>
            <Attribute name="TextAngle" value="45"/>
            <Attribute name="LineColor" value="blue"/>
            <Attribute name="LineWidth" value="2.0"/>
            <Attribute name="DataType" value="DATA_TYPE_LINE|DATA_TYPE_MARKER"/>
            <Attribute name="MarkerType" value="MARKER_TYPE_HOLLOW_SQUARE"/>
            <Attribute name="TextColor" value="blue"/>
            <Attribute name="FontStyle" value="3"/>
            <Attribute name="Title"><![CDATA[Line A
Line B
and more]]></Attribute>
        </Data>
        <Data y="{1,3,6,8}">
            <Attribute name="MarkerColor" value="darkblue"/>
            <Attribute name="DataType" value="DATA_TYPE_MARKER"/>
            <Attribute name="MarkerType" value="MARKER_TYPE_FILLED_CIRCLE"/>
            <Attribute name="Title" value="Circle"/>
        </Data>
    </AxisXY>
</Chart>
| © Visual Numerics, Inc. All rights reserved. |
|