JMSL Chart Programmer's Guide


JMSL Chart Programmer's Guide
|
XML >> Examples >> Box Plot |
|
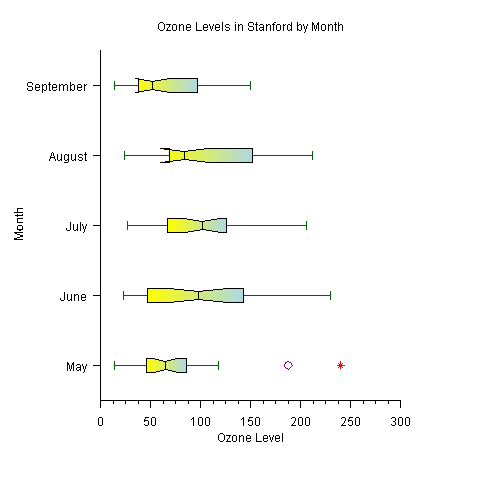
XML Example: Box Plot
<?xml version="1.0" encoding="UTF-8" standalone="no" ?>
<!DOCTYPE Chart PUBLIC "-//Visual Numerics//DTD JMSL Chart//EN" "http://www.vni.com/products/jmsl/Chart.dtd">
<Chart>
    <Array id="ozone">
        <Array>
             <NumberList>
                    66.0, 52.0, 49.0, 64.0, 68.0, 26.0, 86.0, 52.0,
                    43.0, 75.0, 87.0, 188.0, 118.0, 103.0, 82.0,
                    71.0, 103.0, 240.0, 31.0, 40.0, 47.0, 51.0, 31.0,
                    47.0, 14.0, 71.0
             </NumberList>
         </Array>
         <Array>
             <NumberList>
                    61.0, 47.0, 196.0, 131.0, 173.0, 37.0, 47.0,
                    215.0, 230.0, 69.0, 98.0, 125.0, 94.0, 72.0,
                    72.0, 125.0, 143.0, 192.0, 122.0, 32.0, 114.0,
                    32.0, 23.0, 71.0, 38.0, 136.0, 169.0
             </NumberList>
         </Array>
         <Array>
             <NumberList>
                    152.0, 201.0, 134.0, 206.0, 92.0, 101.0, 119.0,
                    124.0, 133.0, 83.0, 60.0, 124.0, 142.0, 124.0, 64.0,
                    75.0, 103.0, 46.0, 68.0, 87.0, 27.0,
                    73.0, 59.0, 119.0, 64.0, 111.0
             </NumberList>
         </Array>
         <Array>
             <NumberList>
                    80.0, 68.0, 24.0, 24.0, 82.0, 100.0, 55.0, 91.0,
                    87.0, 64.0, 170.0, 86.0, 202.0, 71.0, 85.0, 122.0,
                    155.0, 80.0, 71.0, 28.0, 212.0, 80.0, 24.0,
                    80.0, 169.0, 174.0, 141.0, 202.0
            </NumberList>
         </Array>
         <Array>
            <NumberList>
                    113.0, 38.0, 38.0, 28.0, 52.0, 14.0, 38.0, 94.0,
                    89.0, 99.0, 150.0, 146.0, 113.0, 38.0, 66.0, 38.0,
                    80.0, 80.0, 99.0, 71.0, 42.0, 52.0, 33.0, 38.0,
                    24.0, 61.0, 108.0, 38.0, 28.0
            </NumberList>
         </Array>
    </Array>
    <Array id="months"><String value="May"/><String value="June"/><String value="July"/><String value="August"/><String value="September"/></Array>
    <Array id="grad"><Color value="yellow"/><Color value="lightblue"/><Color value="lightblue"/><Color value="yellow"/></Array>

    <ChartTitle><Attribute name="Title" value="Ozone Levels in Stanford by Month"/></ChartTitle>
    <AxisXY>
        <BoxPlot obs="#ozone">
            <Attribute name="BoxPlotType" value="BOXPLOT_TYPE_HORIZONTAL"/>
            <Attribute name="Labels" value="#months"/>
            <Attribute name="Notch" value="true"/>
            <Attribute name="ProportionalWidth" value="true"/>
            <Bodies>
                <Attribute name="FillType" value="FILL_TYPE_GRADIENT"/>
                <Attribute name="Gradient" value="#grad"/>
            </Bodies>
            <OutsideMarkers>
                <Attribute name="MarkerType" value="MARKER_TYPE_HOLLOW_CIRCLE"/>
                <Attribute name="MarkerColor" value="purple"/>
            </OutsideMarkers>
            <FarMarkers>
                <Attribute name="MarkerType" value="MARKER_TYPE_ASTERISK"/>
                <Attribute name="MarkerColor" value="red"/>
            </FarMarkers>
            <Whiskers>
                <Attribute name="MarkerColor" value="darkgreen"/>
            </Whiskers>
        </BoxPlot>
        <AxisY>
            <AxisTitle><Attribute name="Title" value="Month"/></AxisTitle>
        </AxisY>
        <AxisX>
            <AxisTitle><Attribute name="Title" value="Ozone Level"/></AxisTitle>
            <Attribute name="TextFormat" value="#"/>
        </AxisX>
    </AxisXY>
</Chart>
| © Visual Numerics, Inc. All rights reserved. |
|