 |
Improving the tonal range of an image is the first step that should be taken in almost every effort to touch up and enhance a photo. To do this, it is necessary to understand the basic elements of tonal range and the tools the GIMP provides to measure and affect it.
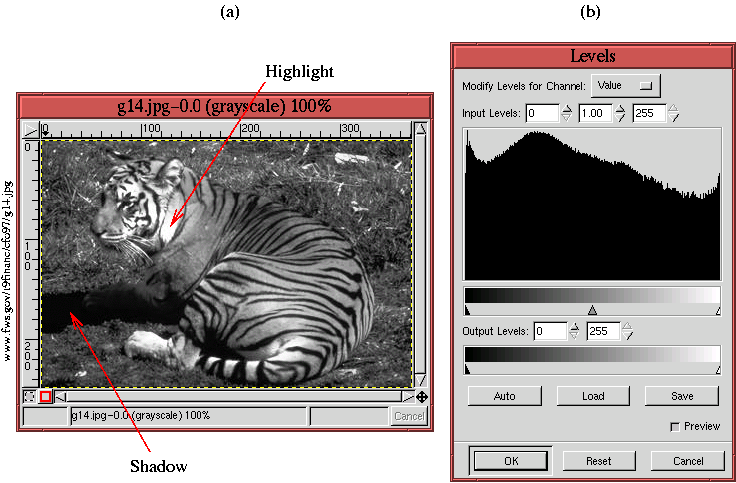
What is tonal range? To answer this question, let's look at the
grayscale photo shown in Figure 6.1(a).
The lightest part of an image is called the highlight and the darkest is called the shadow. It is important to note that not all images will have the maximum highlight of 255 and/or the minimum shadow of 0. Thus, the tonal range of an image is just the numeric difference between the image's maximum highlight and its minimum shadow. You will see shortly that measuring highlight and shadow values is useful for performing image enhancement, but before developing this idea, let's examine why tonal range is so important.
Having a full tonal range is generally a good thing. A full tonal
range means that the image has, in a general sense, the fullest
possible contrast. To illustrate this idea, the tonal range of the
image in Figure 6.1(a) can be synthetically
diminished by setting the output sliders of the Levels tool to
values well inside the range of 0 to 255. This adjustment is shown
Figure 6.2(b),
This example is based on a grayscale image whose tonal range has been synthetically impoverished. Nevertheless, the conclusions that can be drawn from it are general. That is, maximizing tonal range is usually a great way to enhance an image. However, sometimes it is better not to maximize the tonal range. An image of white lace gloves on a white linen tablecloth background is such an example. Under these circumstances, there is a subtle interplay of whites and off-whites in the image, and a deep black shadow is most likely undesirable. In most cases, however, getting the most tonal range out of an image improves contrast, which in turn significantly enhances the image.
The Levels tool is found in the Image:Image/Colors menu, and it was used in the previous section to examine the tonal range of a grayscale image. The features of this tool and how it can be applied to color images is discussed in detail here.
Figure 6.3
The histogram is a very important feature of the Levels tool because it immediately shows whether a channel occupies its entire tonal range or not. Just below the histogram is a grayscale called the input value domain. In this grayscale, black represents pixel values of 0 and white values of 255. Thus, for the Green channel shown in Figure 6.3, the black of the input value domain represents dark values of green and the white represents bright values of green. Having no histogram over a part of the input value range means that there are no pixels in the image having these values. Thus, in Figure 6.3, you can see that there is a lack of tonal range because there are significant parts of the upper and lower input value range that have no histogram values over them.
The remaining features of the Levels dialog are for adjusting the distribution of the histogram. The leftmost and rightmost arrows of the input control slider are used for stretching the tonal range of the image; the middle arrow can be used to warp the range. The leftmost arrow is called the shadow control arrow, the rightmost is the highlight control arrow, and the middle is the midtone control arrow. The arrows of the output control slider are used for shrinking the tonal range. Adjustments to the control arrows can be made interactively by clicking and dragging them. The arrows can also be controlled numerically by entering values for the min, gamma, and max input levels or for the min and max output levels.
The following example shows how the adjustment features of the Levels tool function. Figure 6.4
Figure 6.6
The maximization of an image's tonal range using the Levels tool can introduce color casts (see Section 6.2 for a definition of color casts). In fact, the turtle in Figure 6.7 appears to have a slight magenta cast. But don't worry! Color casts introduced using the Levels tool can be corrected using the Curves tool, which is treated in the next section.
A final note before leaving this section is appropriate. The Levels dialog shown in Figure 6.3 shows a button labeled Auto Levels. This button pretty much automates what has been described in this section. That is, it maximizes the tonal range in the Red, Green, and Blue channels. In fact, it moves the shadow and highlight input control sliders for each channel to about the 5% and 95% points of the histogram. After applying Auto Levels, any of the Red, Green, or Blue channels can be reviewed and modified.